#visualization
 ART
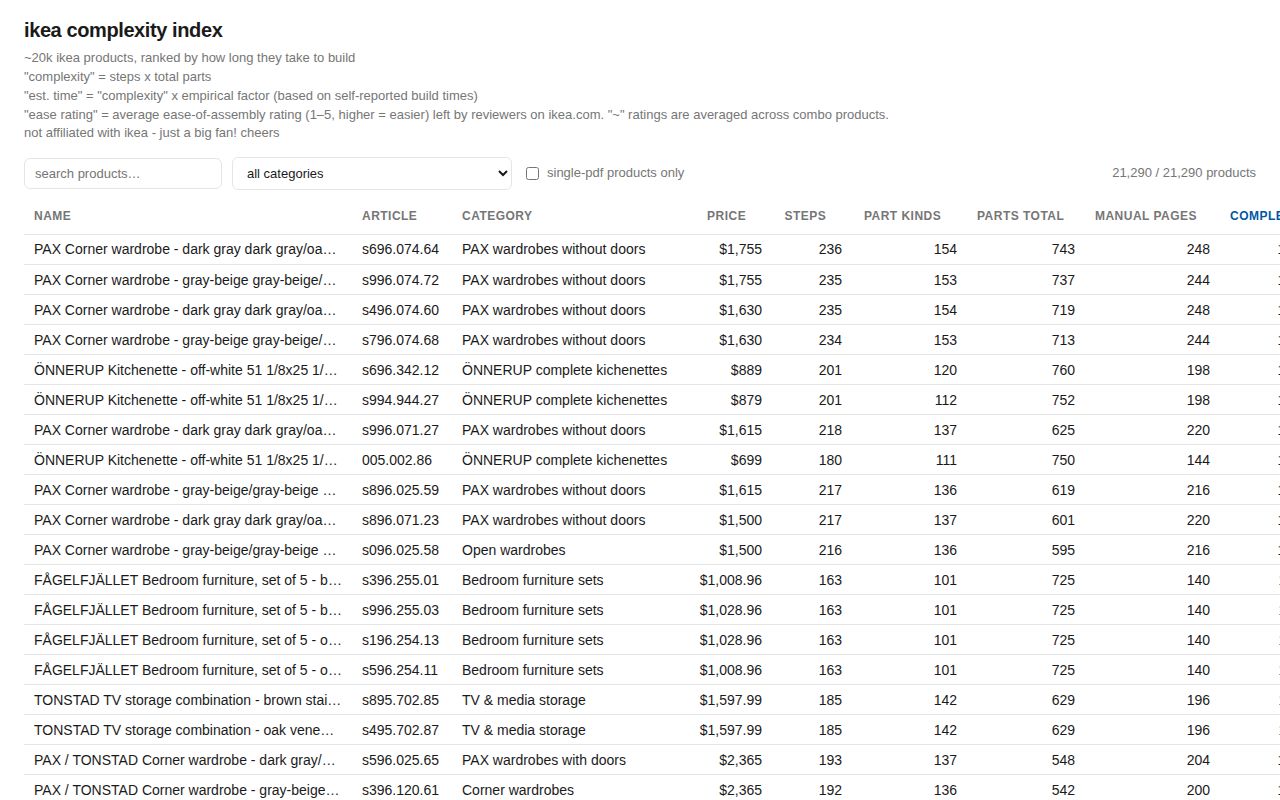
ART IKEA Complexity Index
Interactive tool visualizing assembly complexity across IKEA's product catalog. Handcrafted reference site offering a novel way to explore and understand IKEA products.
 ART
ART Steven Wittens (Acko.net)
Mind-bending interactive visualizations and technical essays on math, graphics, and computing. Creator of MathBox and pioneering WebGL work.
 ART
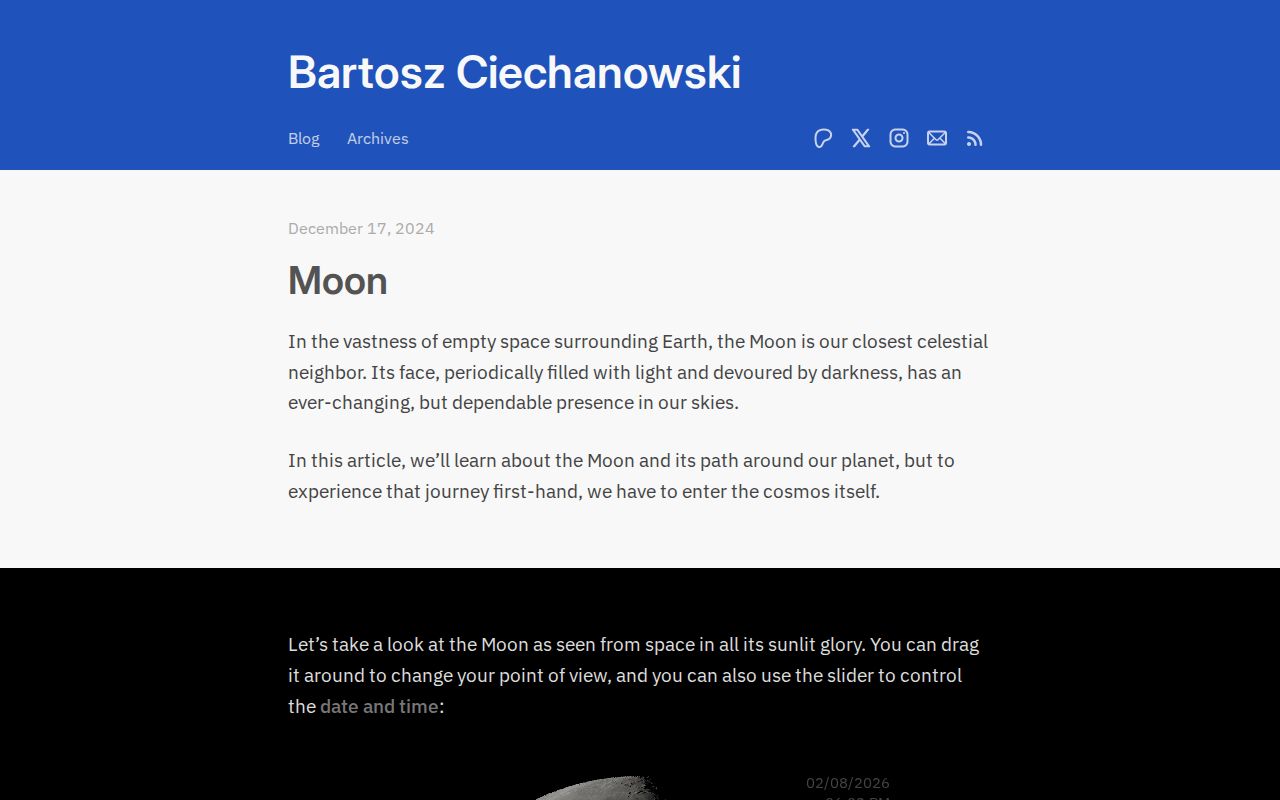
ART Bartosz Ciechanowski
Stunning interactive explainers on mechanical watches, GPS, cameras, and more. Engineering education at its finest.
 ART
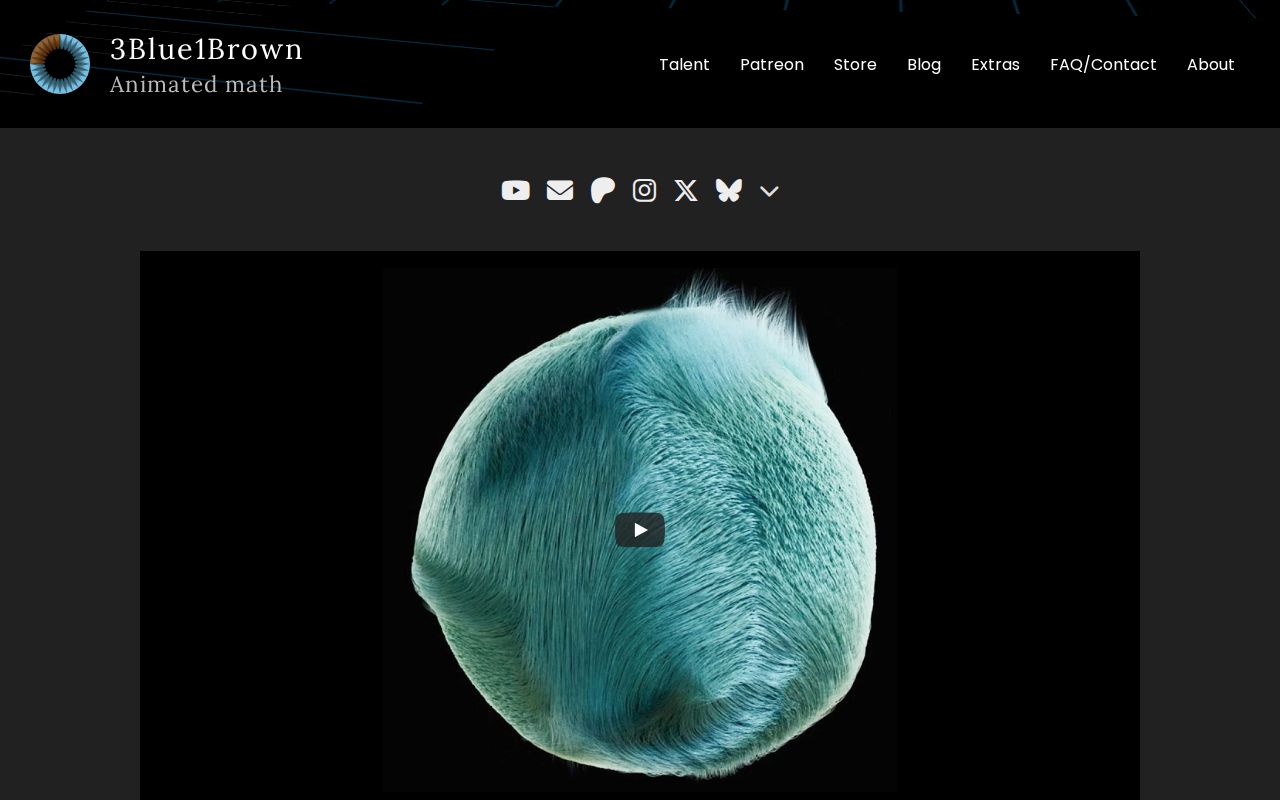
ART 3Blue1Brown
Grant Sanderson's math animations. Beautiful visualizations that build genuine understanding.
 ART
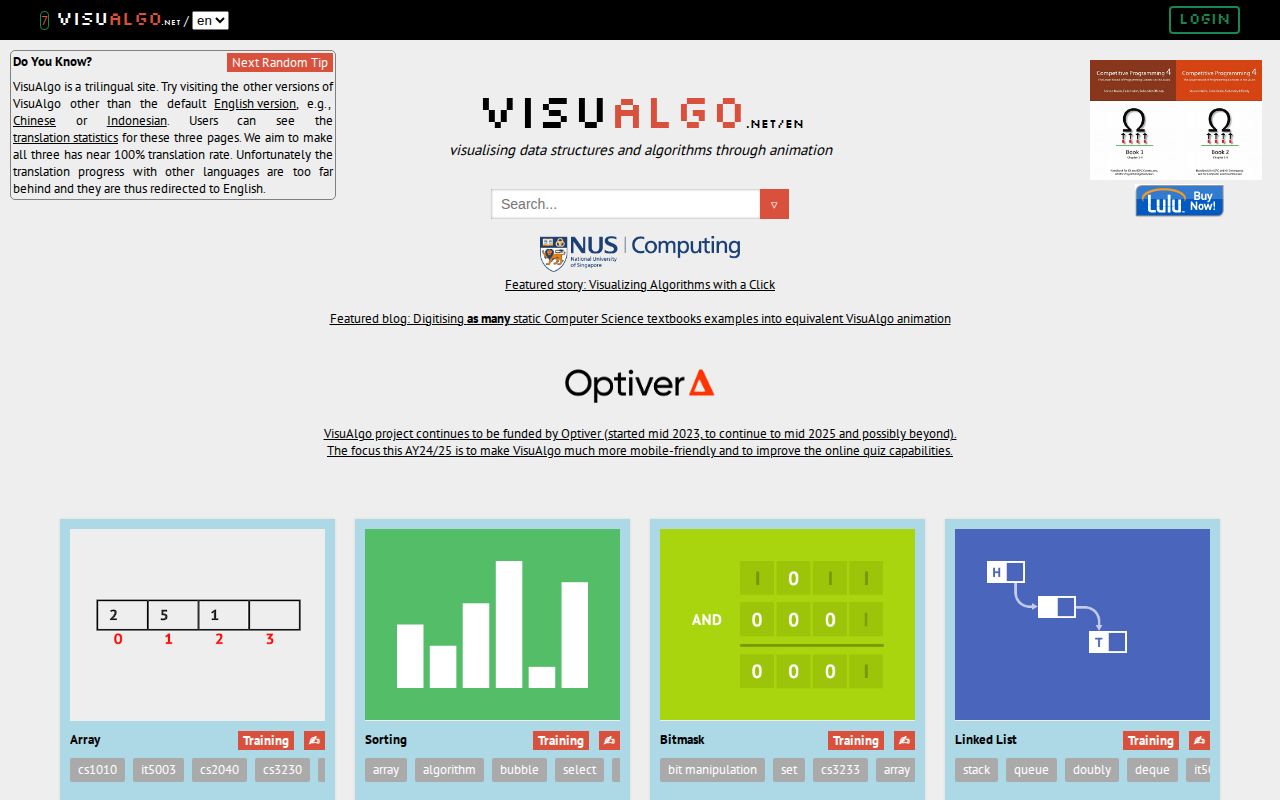
ART VisuAlgo
Visualize algorithms and data structures. Step through sorting, trees, graphs, and more.
 ART
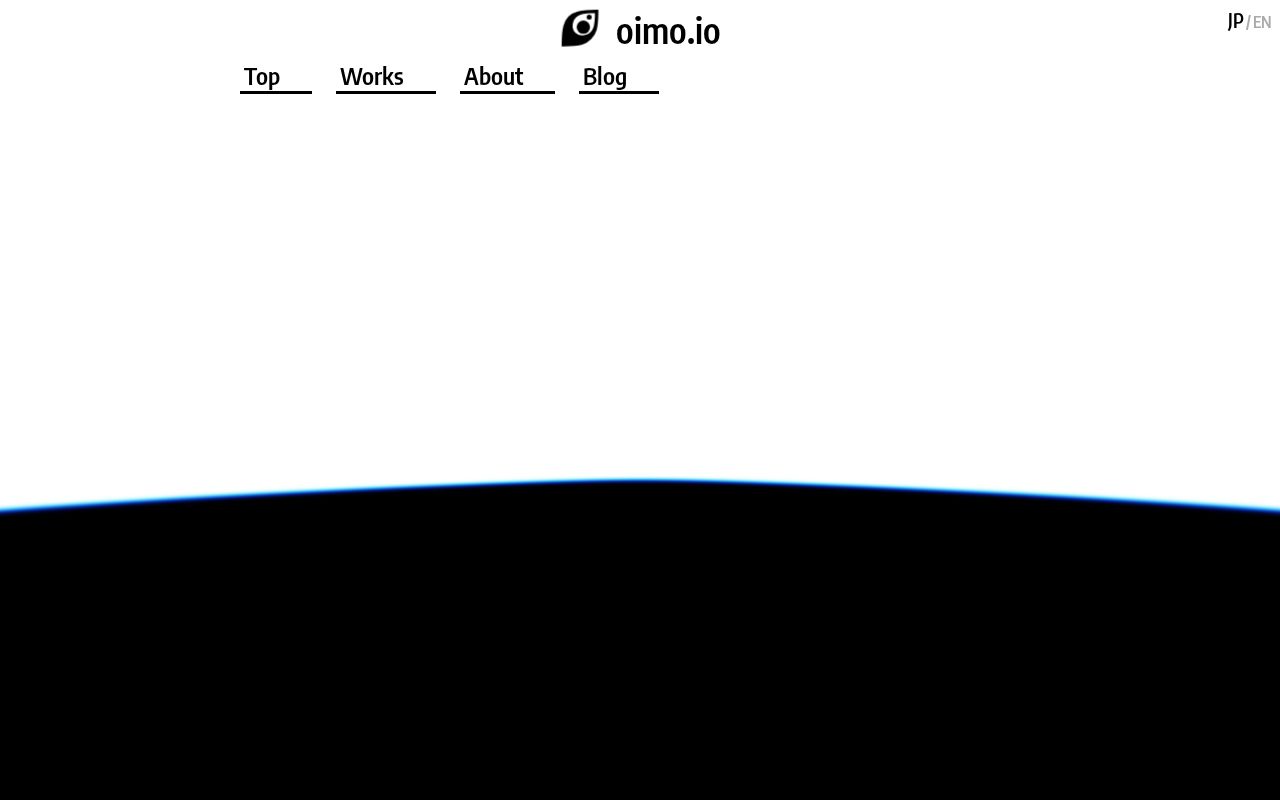
ART oimo.io
Beautiful interactive web experiments. Includes Bubbles and an infinitely zoomable Game of Life.
 ART
ART ShadeMap
3D shade map of the entire world. See shadows from mountains, buildings, and trees for any date and time.
 ART
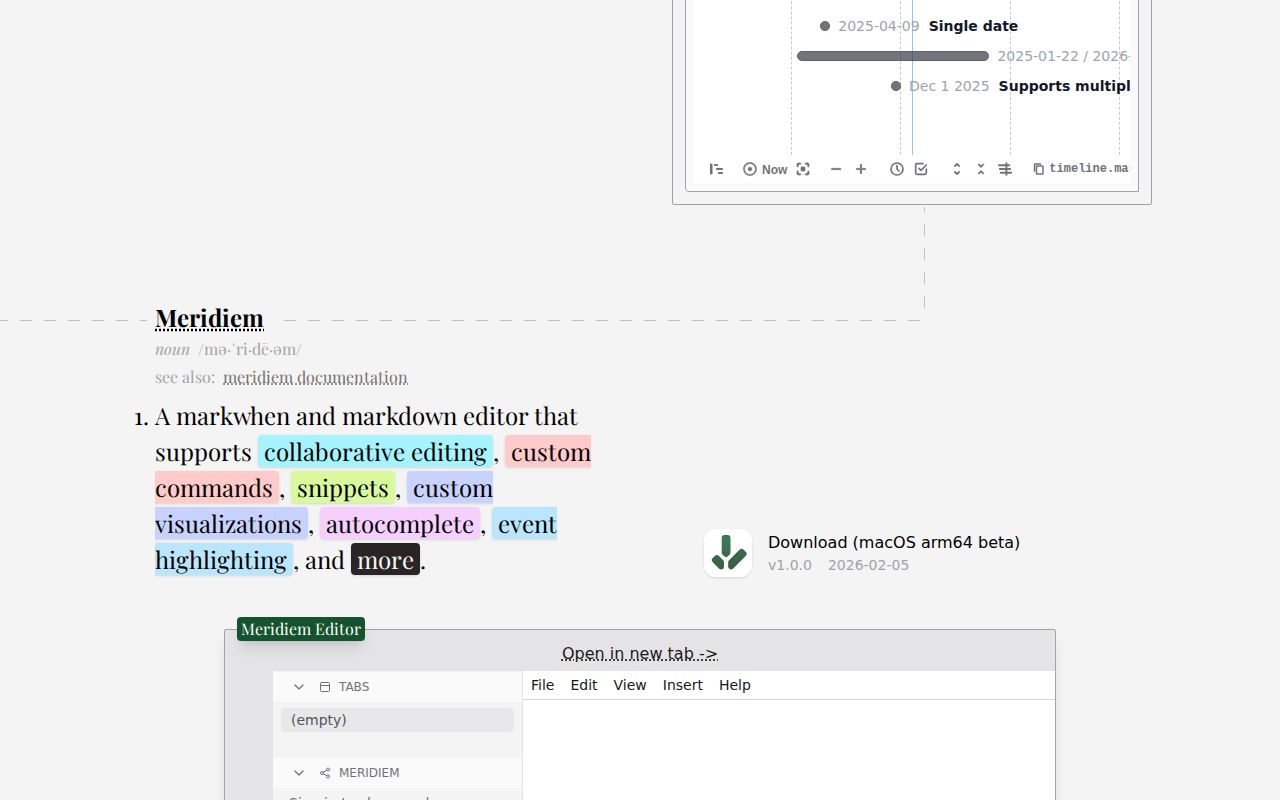
ART Markwhen
Markdown for timelines. Write dates and events in plain text, get a beautiful timeline visualization.
 ART
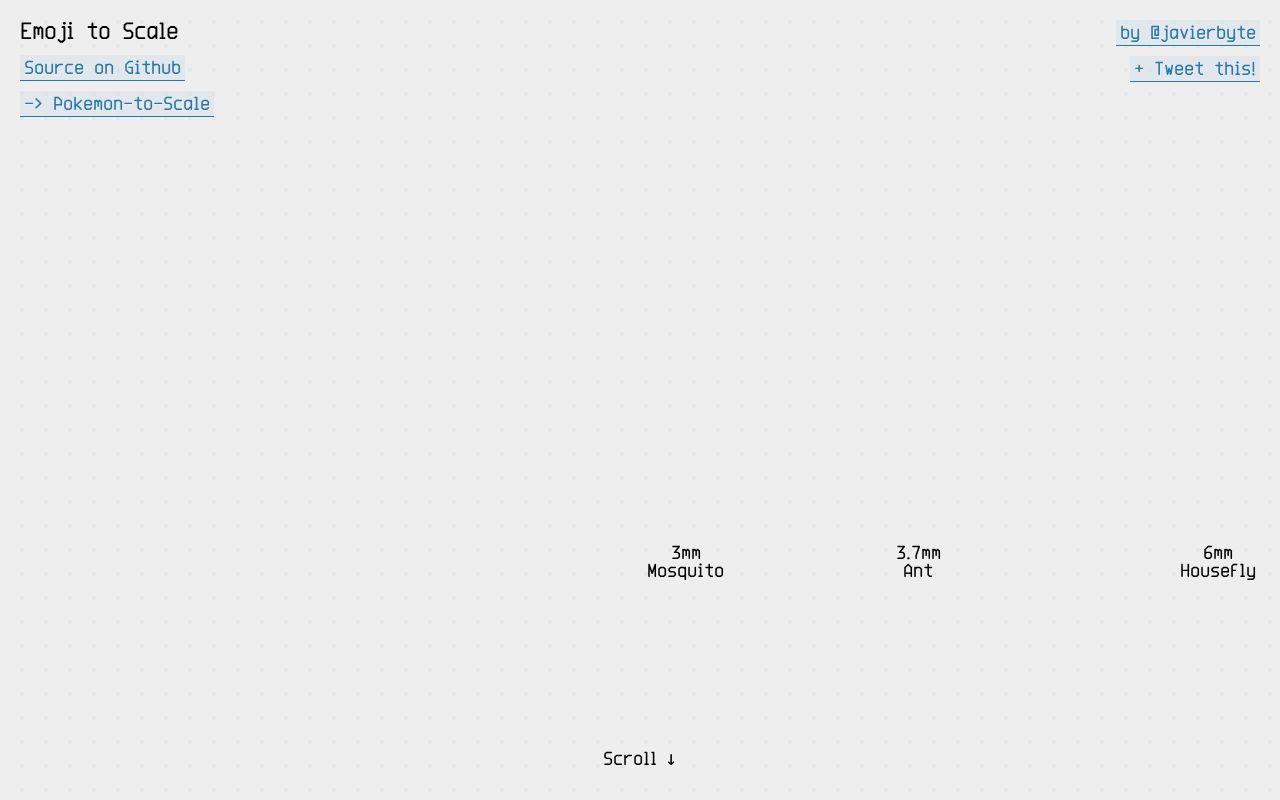
ART Emoji to Scale
Explore the relative sizes of emoji objects. Scroll through a visual comparison from atoms to galaxies.
 ART
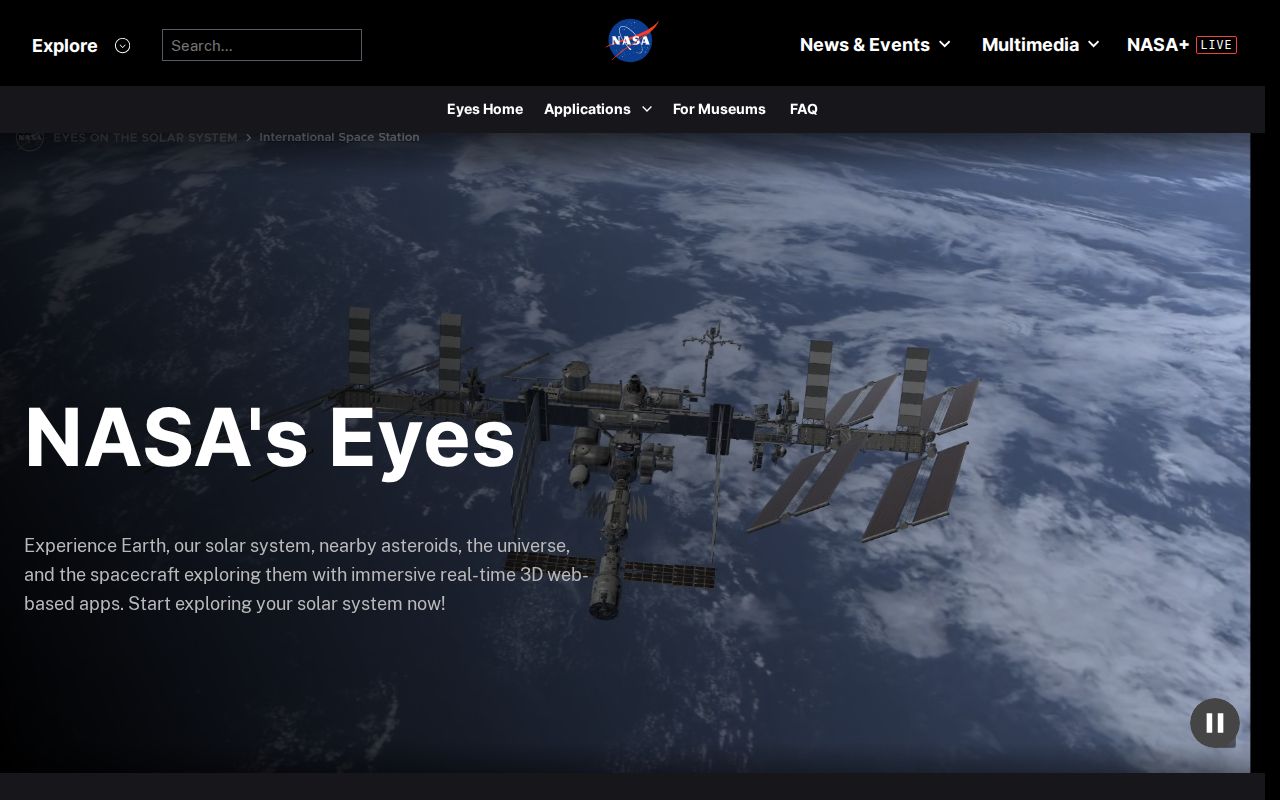
ART NASA's Eyes
3D visualization of our solar system, Earth, and NASA missions. Explore space from your browser.
 ART
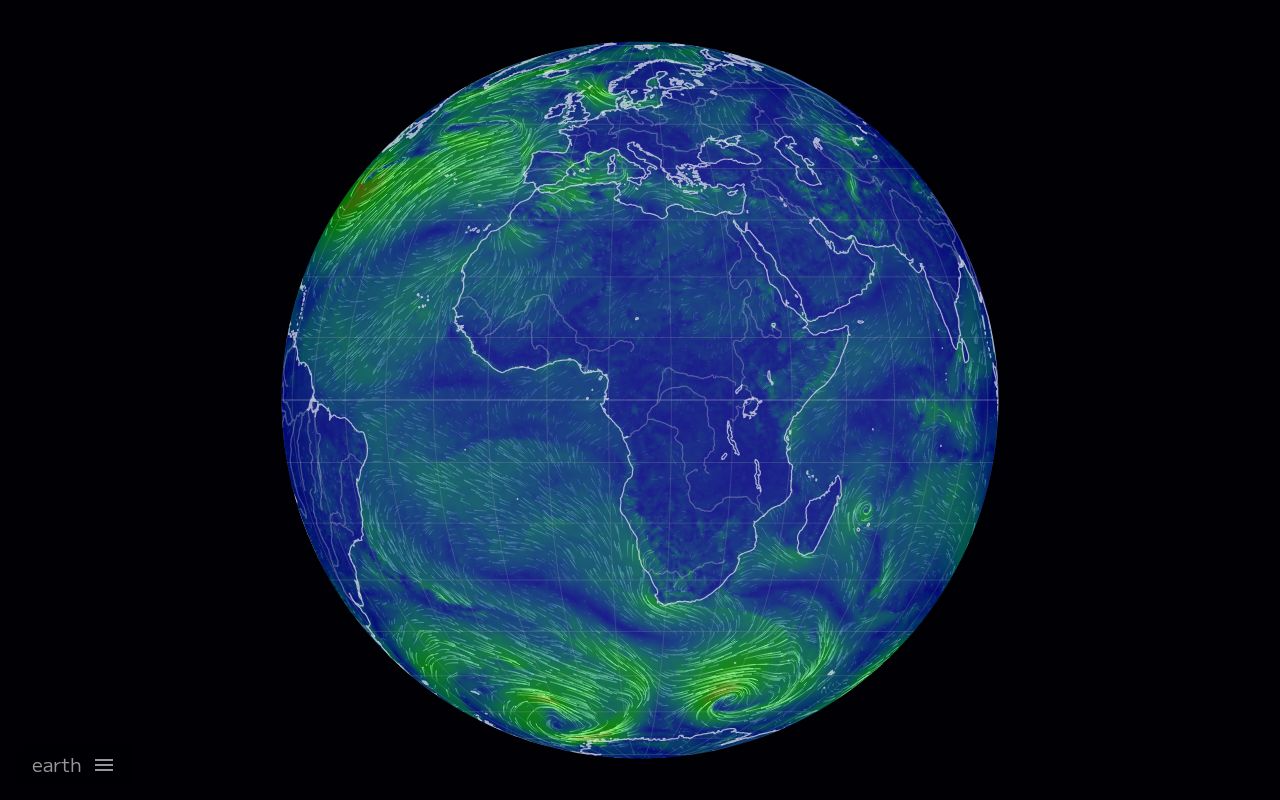
ART Earth Wind Map
Real-time visualization of global weather conditions. Hypnotic animation of wind, temperature, and more.
 ART
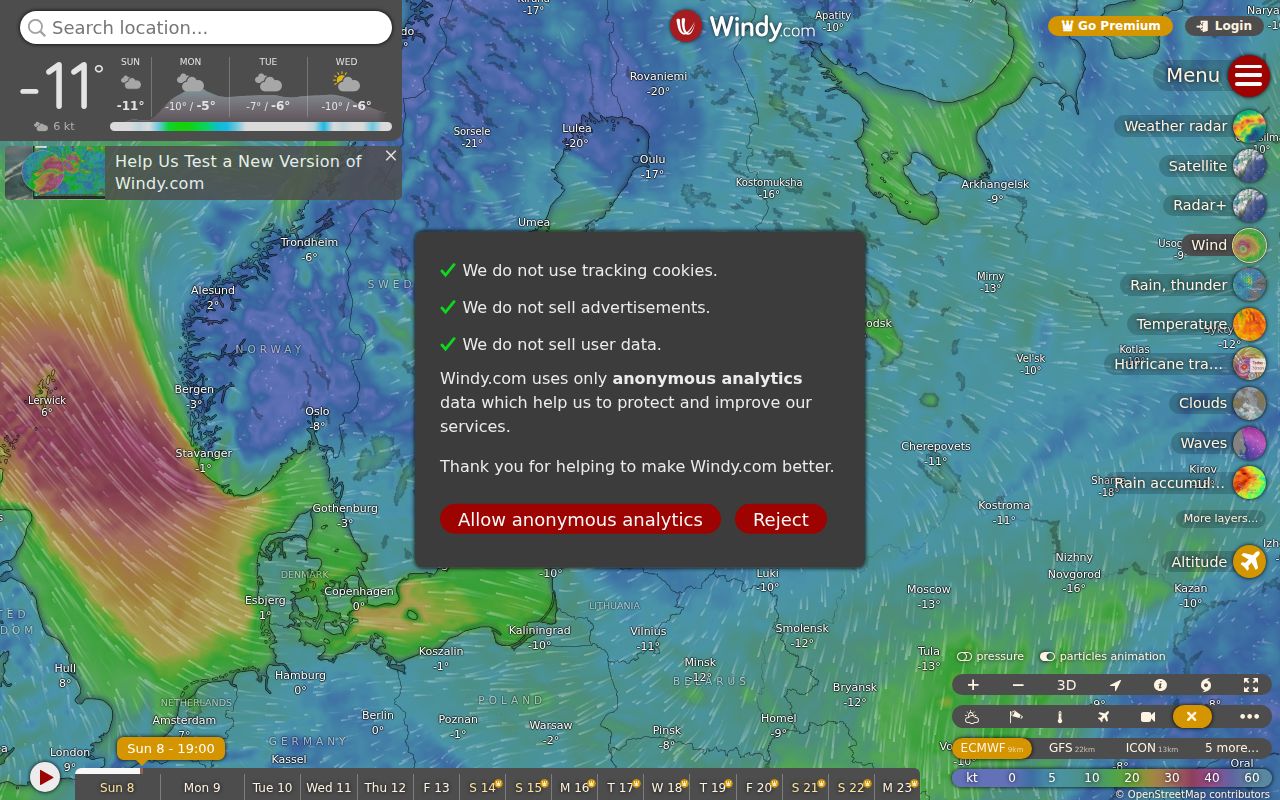
ART Windy
Beautiful weather forecasting. Detailed models, radar, and satellite imagery in an elegant interface.
 ART
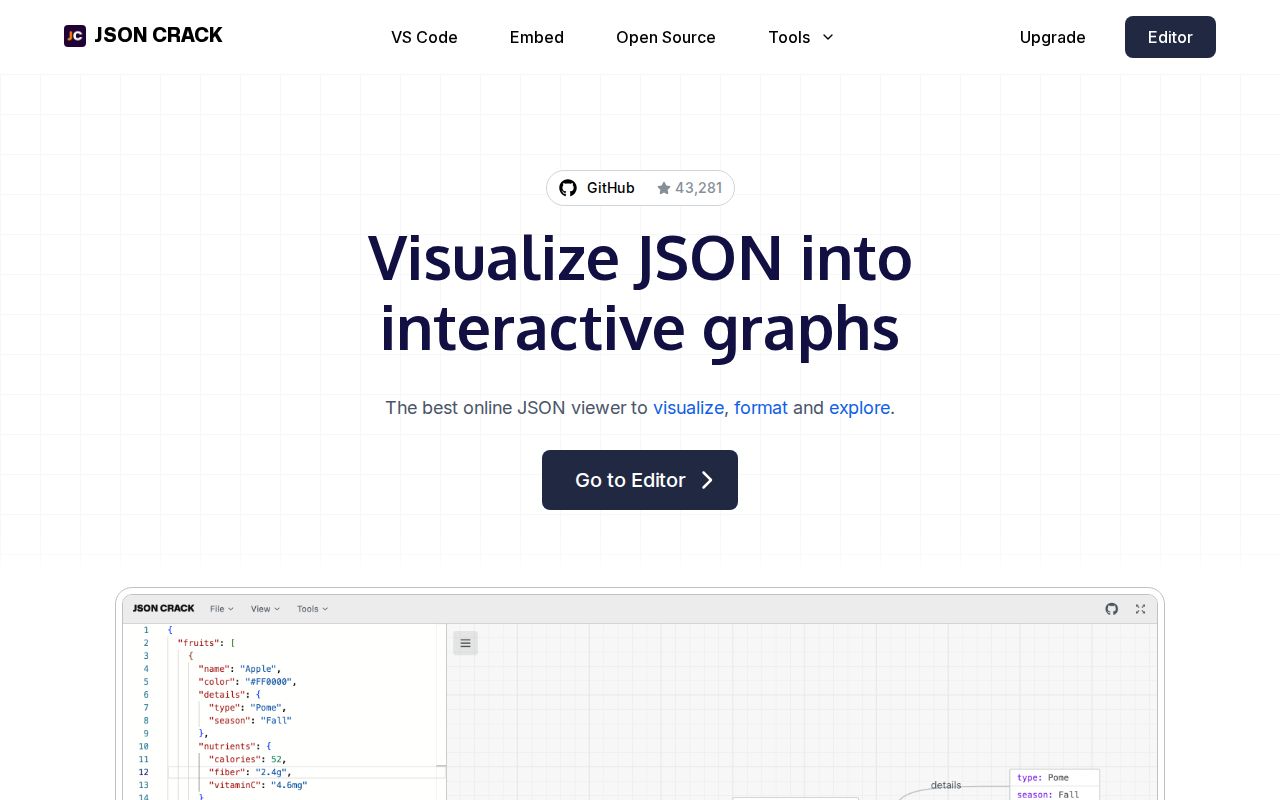
ART JSON Crack
Visualize JSON data as interactive graphs. Makes complex nested structures actually understandable.
 ART
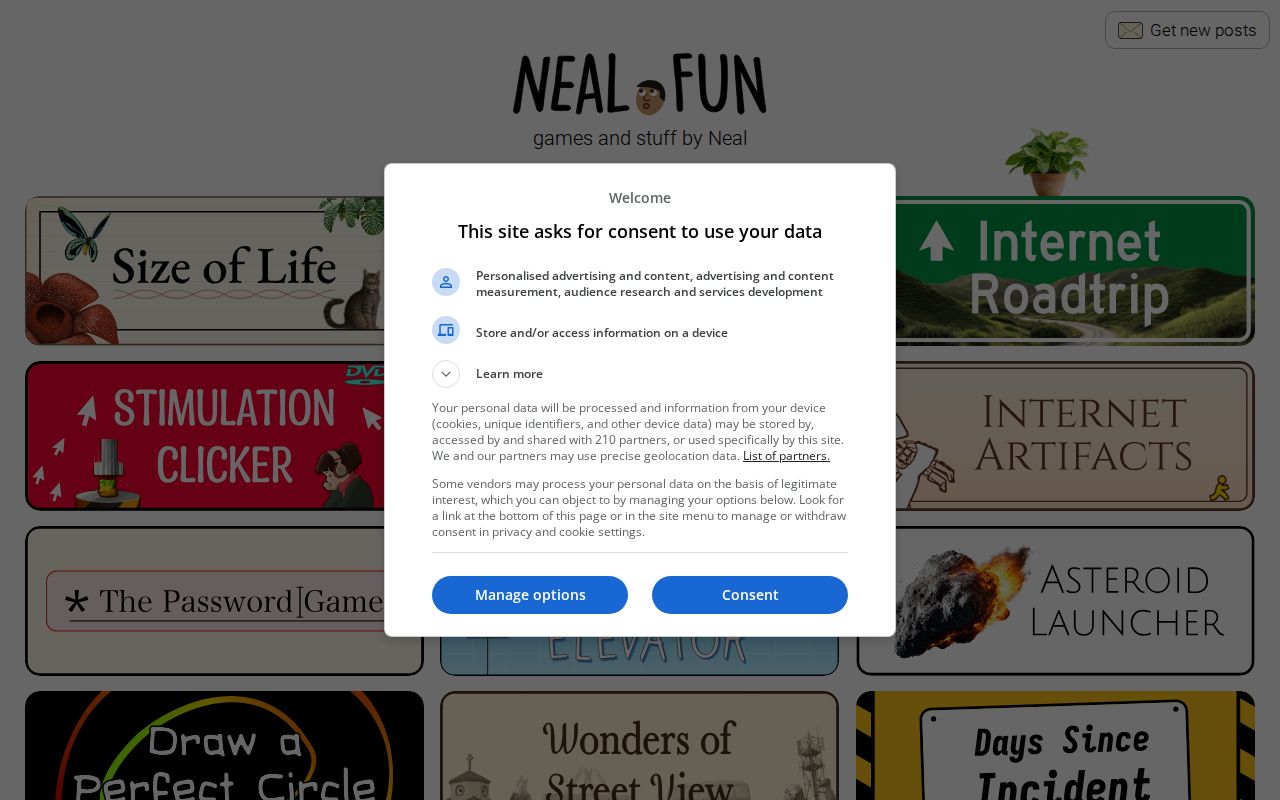
ART Neal.fun
Collection of delightful interactive experiences. Spend Bill Gates' money, explore the deep sea, draw perfect circles.
 ART
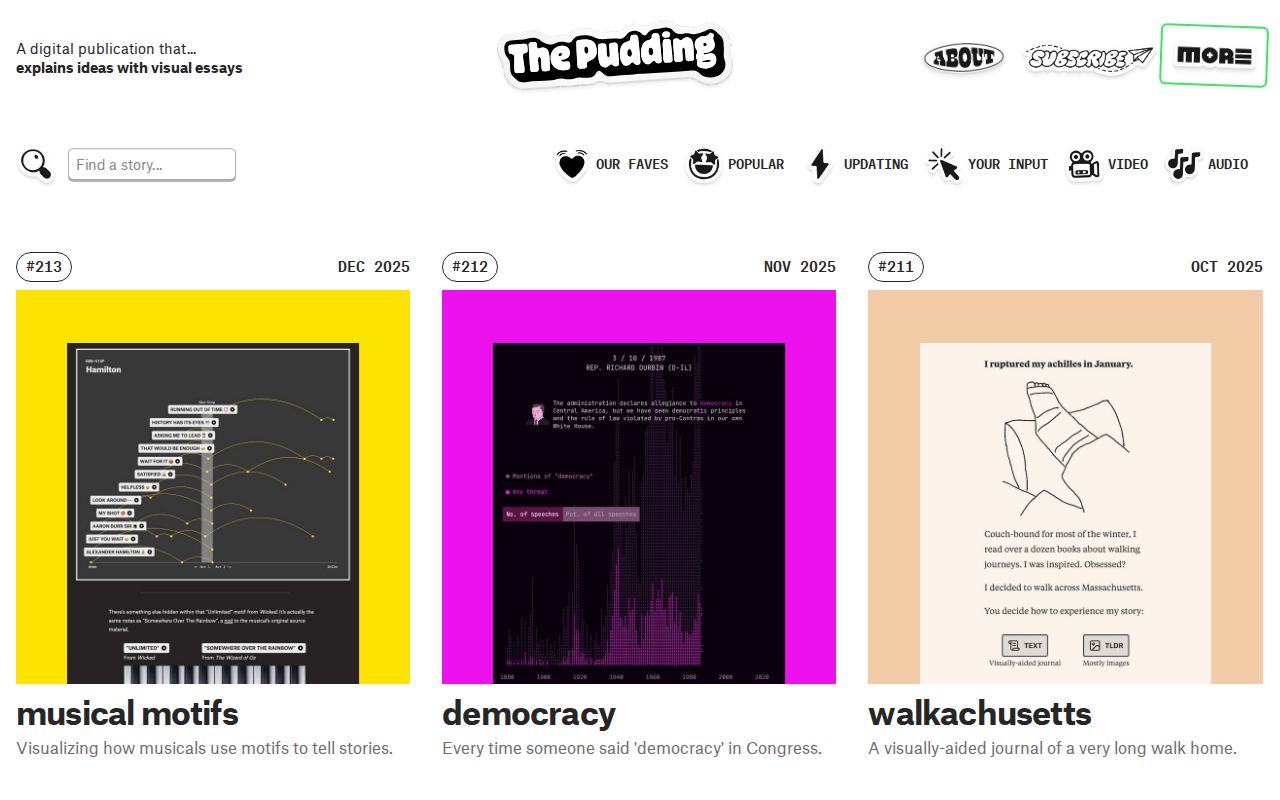
ART The Pudding
Visual essays that explain ideas through data and design. Journalism meets data visualization.
 ART
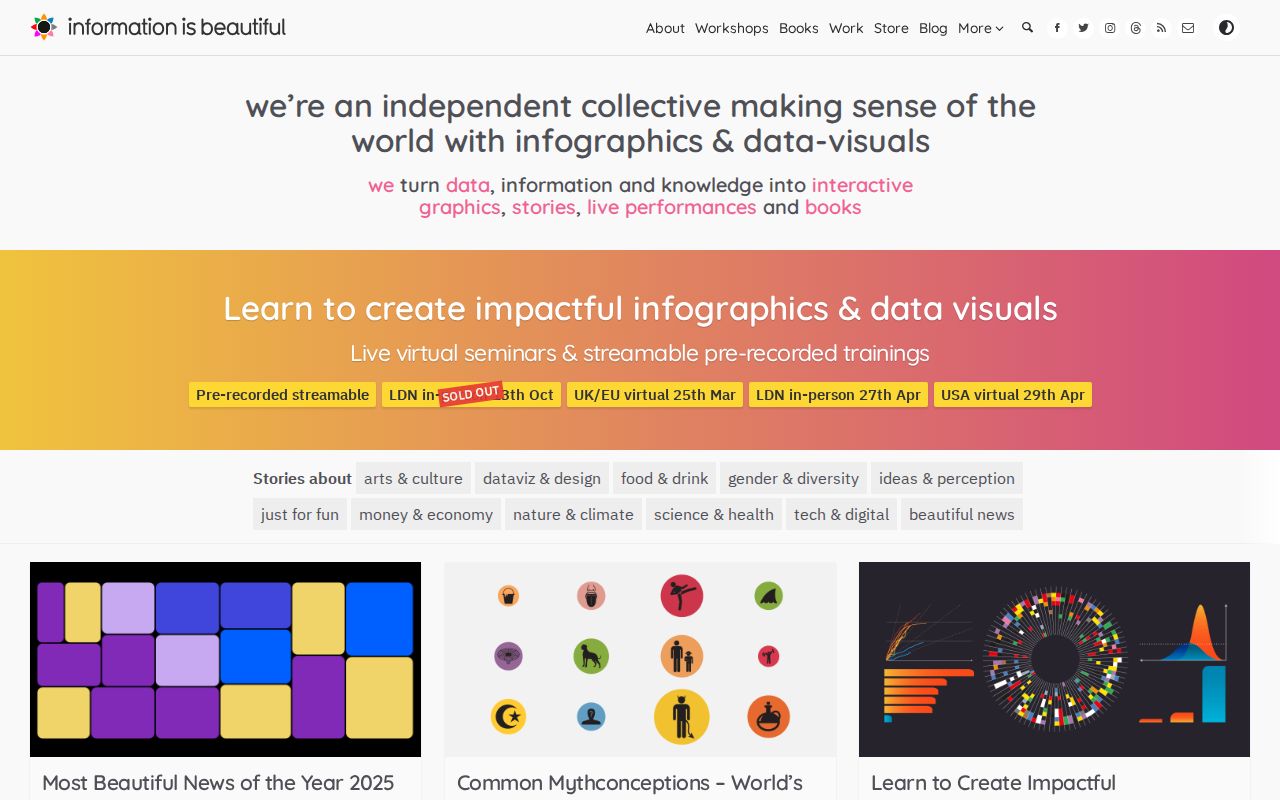
ART Information is Beautiful
Award-winning data visualizations on everything from science to pop culture.