#data
 SCI
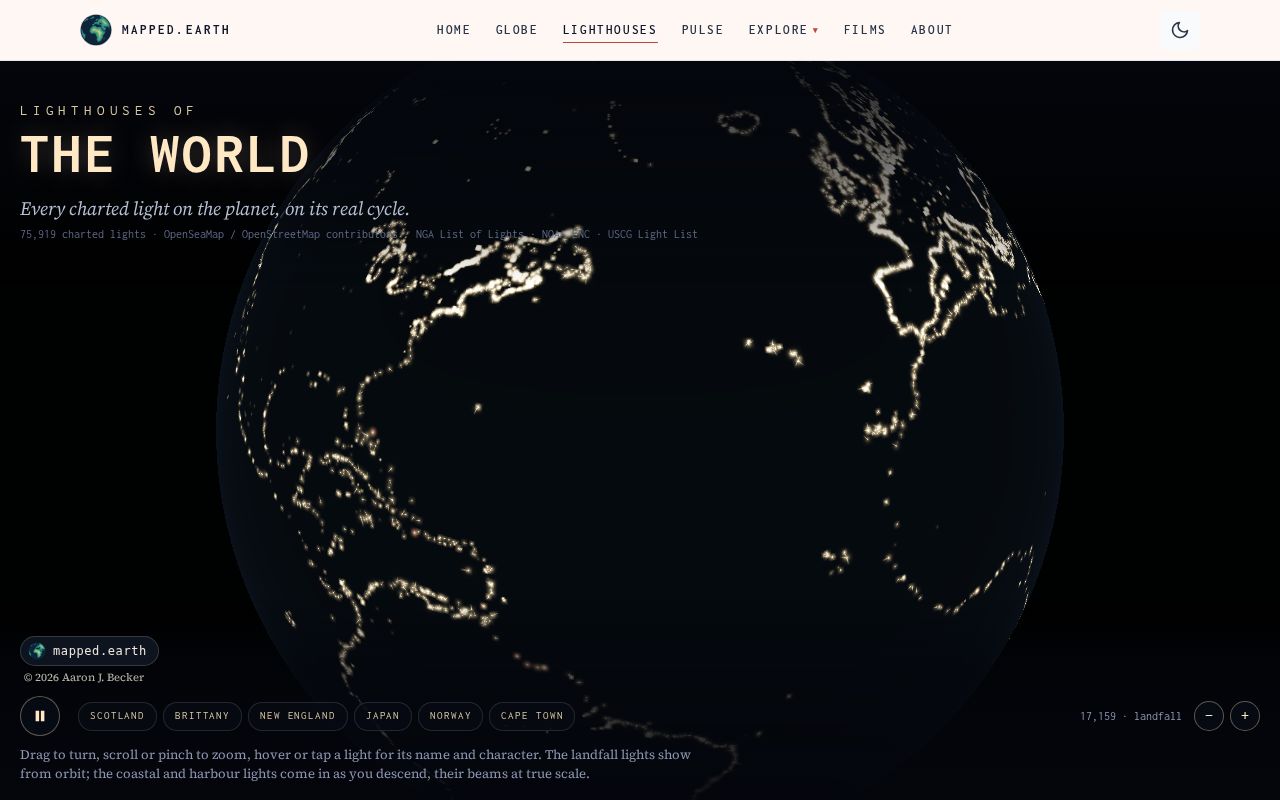
Every lighthouse in the world (mapped.earth)
An interactive 3D night globe plotting every charted navigational light on Earth, each flashing or sweeping at its printed chart rhythm. Zoom to a coastline and hover for a light's name. Reads as a handmade data visualization and creative experiment rather than a product page. Not verified beyond the supplied excerpt, and it is a single subpage of mapped.earth, so confirm the wider site is an independent project.
Atlas - Interactive Research Paper Map
Interactive visualization mapping 8.5M+ research papers from arXiv by field and sub-cluster. Pick a domain, see where research is most active, and explore paper relationships and connections across fields.
 SCI
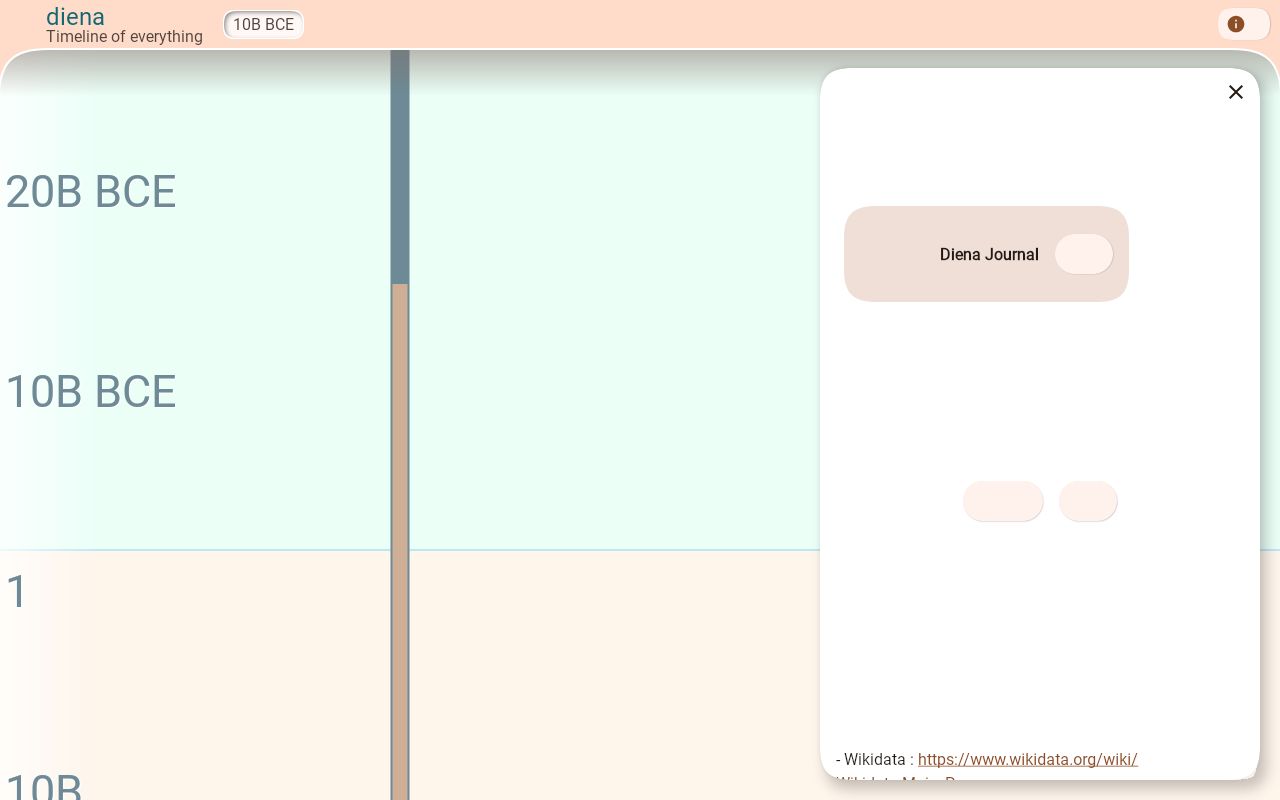
Diena - A Zoomable Timeline of 4M Wikipedia Events
Interactive, zoomable timeline visualization spanning from the Big Bang to present day, with 4 million Wikipedia events mapped across history. A creative data exploration tool.
 SCI
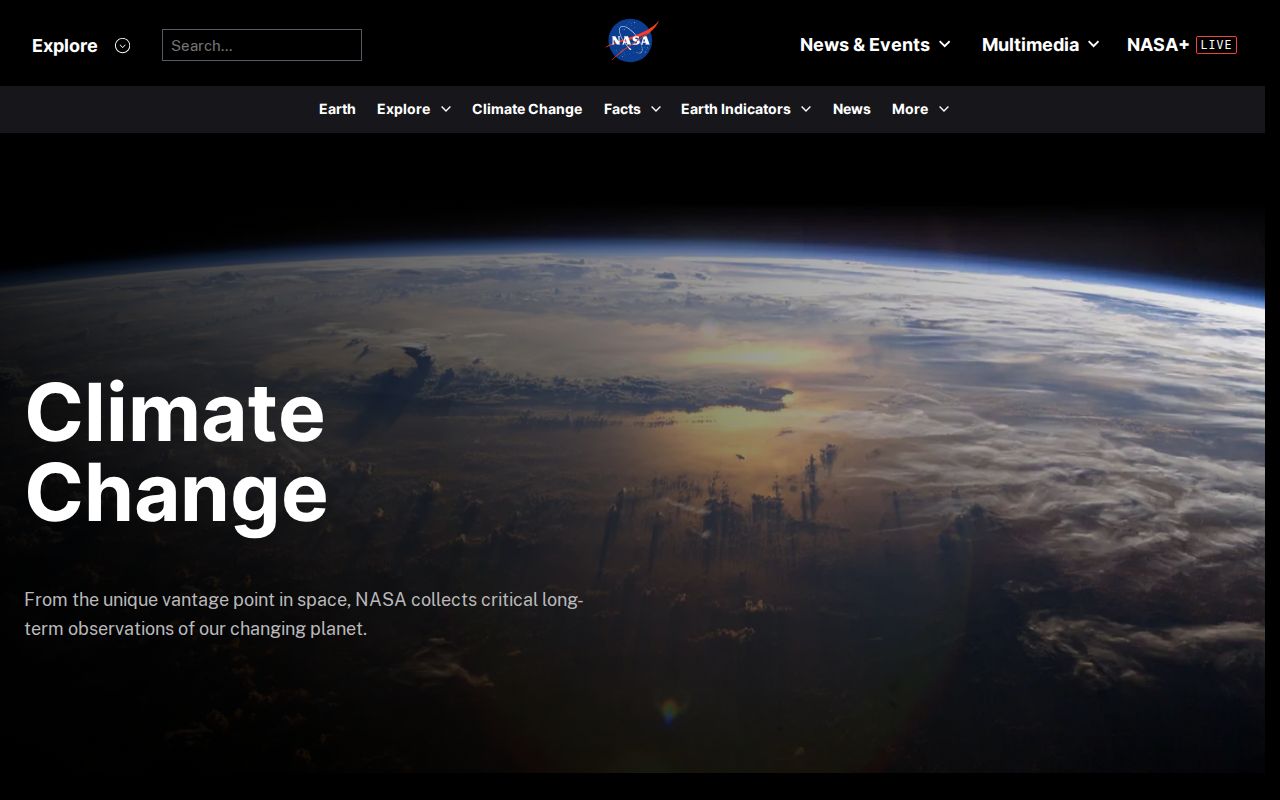
NASA Climate
NASA's portal for climate science. Vital signs of the planet, evidence, and visualizations.
 SCI
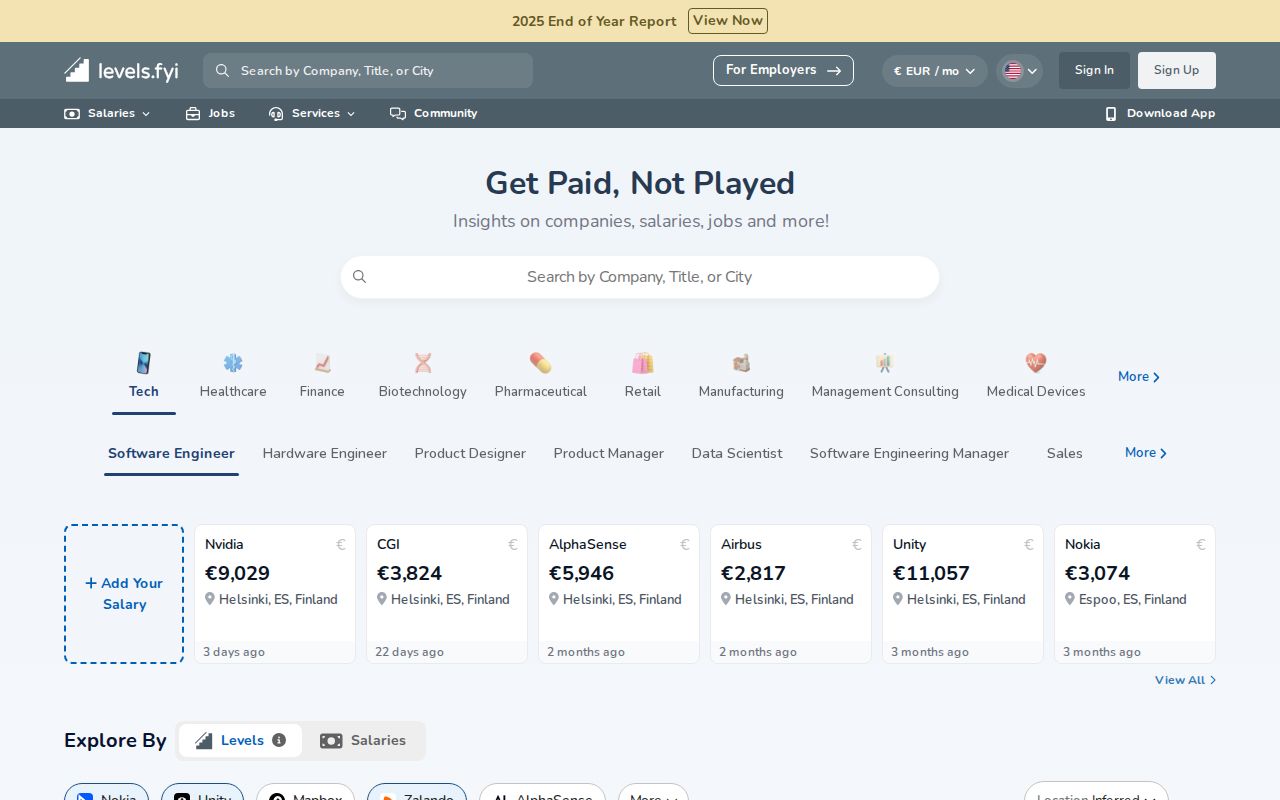
levels.fyi
Tech compensation data. Compare salaries across companies and levels.
EPA
U.S. Environmental Protection Agency. Environmental data and regulations.
 SCI
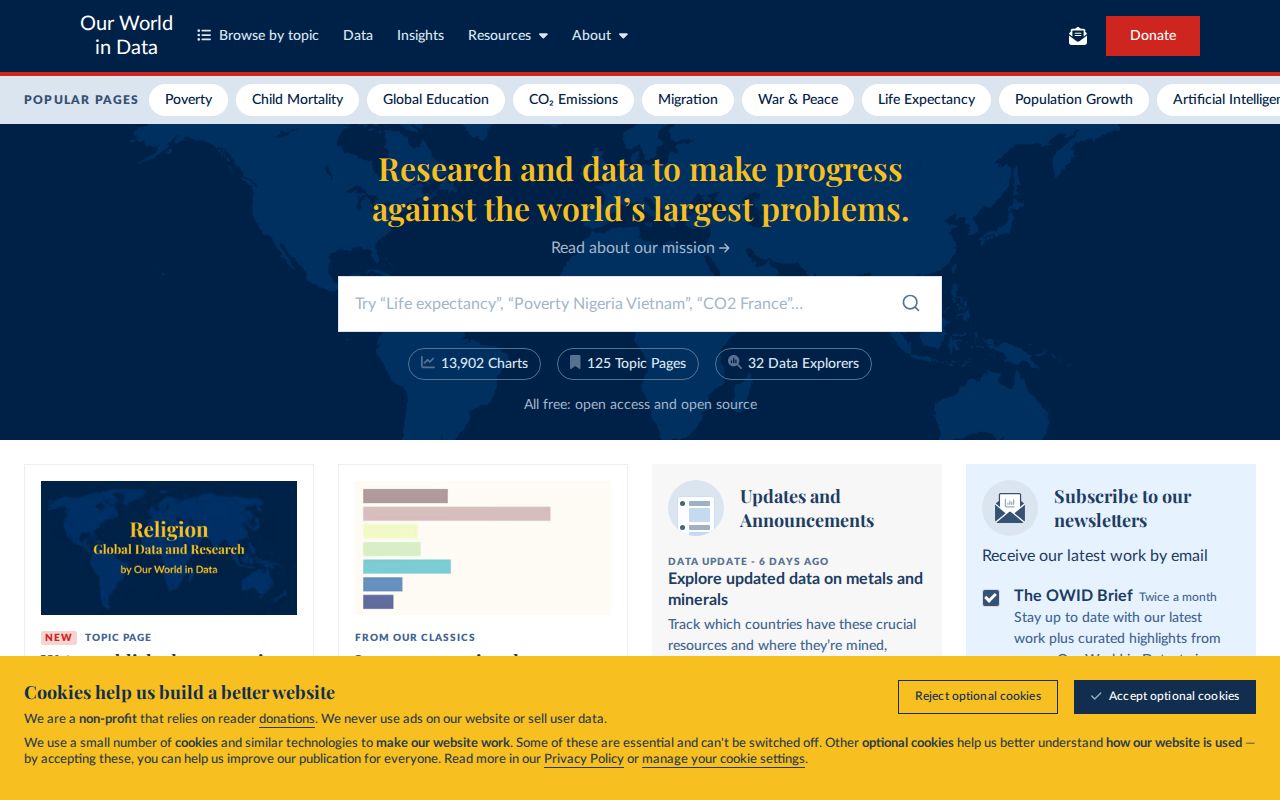
Our World in Data
Research and data to make progress against the world's largest problems. Free, open, accessible.