 SCI
SCI Mark's Blog
Mark Litwintschik on big data, geospatial, and ML infrastructure. Benchmarks and tutorials.
 SCI
SCI Of Dollars And Data
Nick Maggiulli on data-driven personal finance. Evidence-based money decisions.
 SCI
SCI DataTau
Hacker News for data science. Links about machine learning, statistics, data engineering.
 SCI
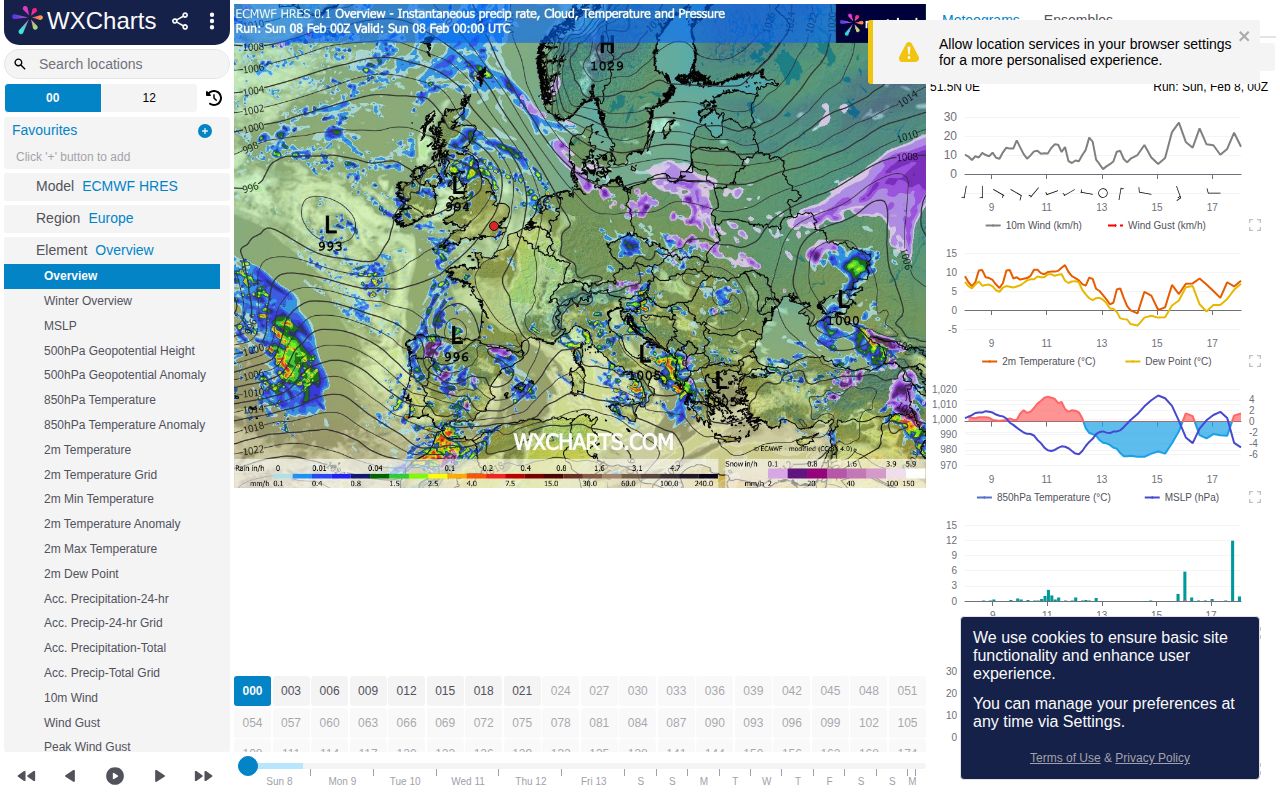
SCI WXCharts
Weather model charts. GFS, ECMWF, and ensemble forecasts.
 SCI
SCI Tropical Tidbits
Tropical weather analysis. Hurricane tracking and model data.
 SCI
SCI Lightning Maps
Real-time lightning strikes worldwide. Community-detected data.
 SCI
SCI Weather Underground
Community weather stations. Hyperlocal forecasts from citizen scientists.
 SCI
SCI Find a Grave
Cemetery records database. Millions of burial records with photos.
 SCI
SCI The Sky Live
Real-time sky events. Planet positions, conjunctions, and eclipses.
 SCI
SCI Natural Earth
Free public domain map data. Vector and raster for cartographers.
 SCI
SCI Global Footprint Network
Ecological footprint data. Track humanity's demand on nature.
 SCI
SCI IPCC Atlas
Interactive climate change atlas. Visualize projections by region.
Climate Watch
Climate data platform. Emissions, commitments, and indicators visualized.
 SCI
SCI Endangered Languages Project
Documenting and preserving endangered languages. Interactive map and resources.
 SCI
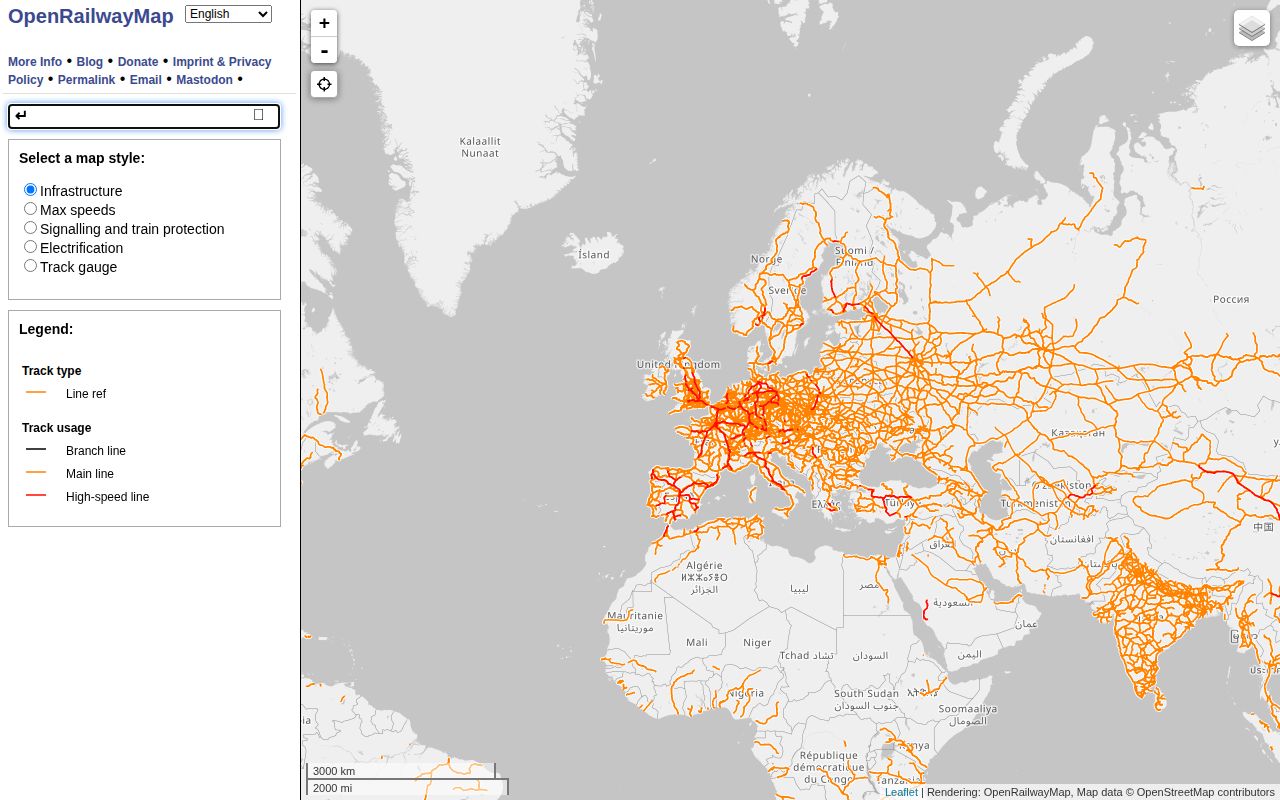
SCI OpenRailwayMap
Worldwide railway infrastructure map. Track layouts, signals, and stations.
 SCI
SCI Film Dev
Community film development database. Recipes and times for any film/developer combo.
 SCI
SCI Speedrun.com
The speedrunning leaderboard. Records, rules, and community for thousands of games.
 SCI
SCI Peakbagger
Peak database and climbing lists. Track summits and explore mountain statistics.
UK Cave Registry
British caving database. Cave locations, surveys, and exploration records.
 SCI
SCI iNaturalist
Biodiversity observation network. AI-assisted species identification and citizen science.
 SCI
SCI Xeno-canto
Worldwide bird sound archive. Community-contributed recordings of over 10,000 species.
 SCI
SCI eBird
Cornell Lab's bird observation database. Log sightings, explore hotspots, and contribute to science.
 SCI
SCI The Wood Database
Encyclopedic wood species reference. Properties, workability, and identification for hundreds of species.
 SCI
SCI N0NBH Solar Resources
Real-time solar and propagation data for hams. HF conditions, solar flux, and band condition widgets.
 SCI
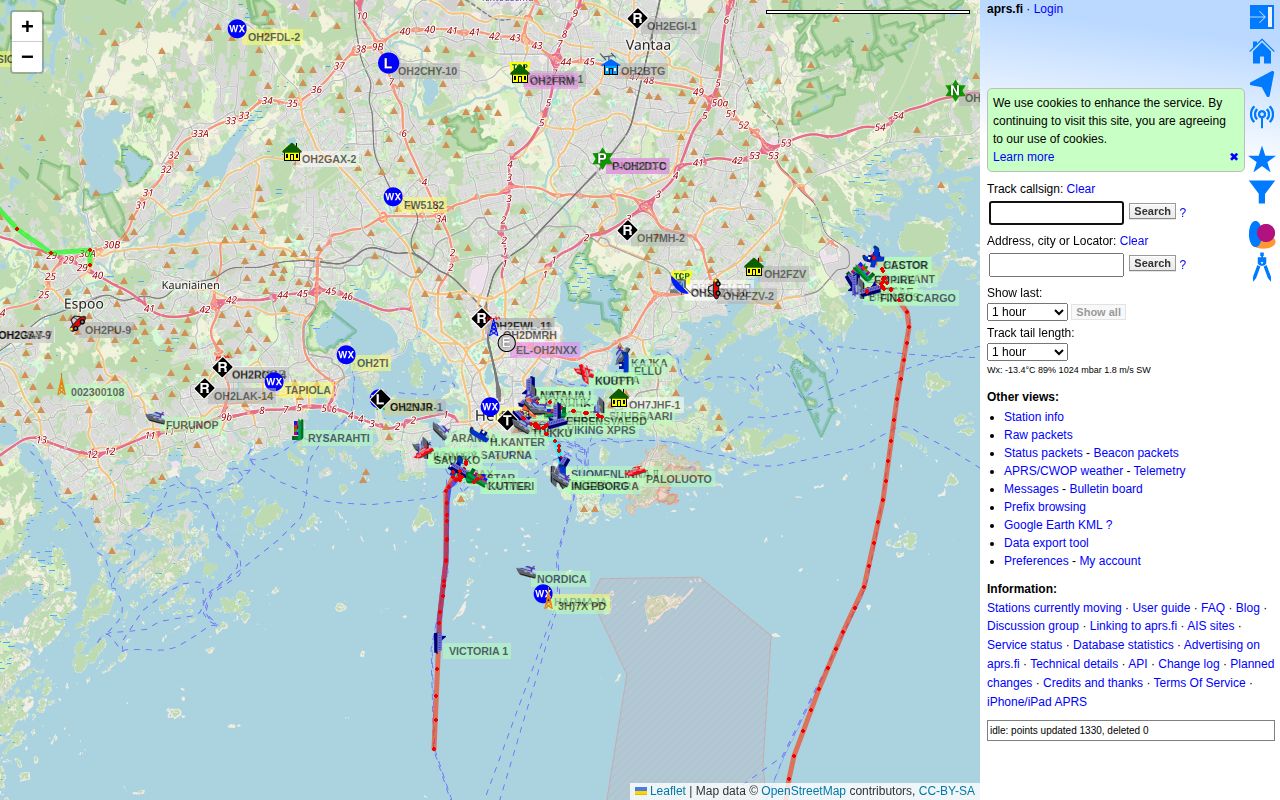
SCI aprs.fi
Real-time APRS tracking map. See amateur radio position reports, weather stations, and objects worldwide.
 SCI
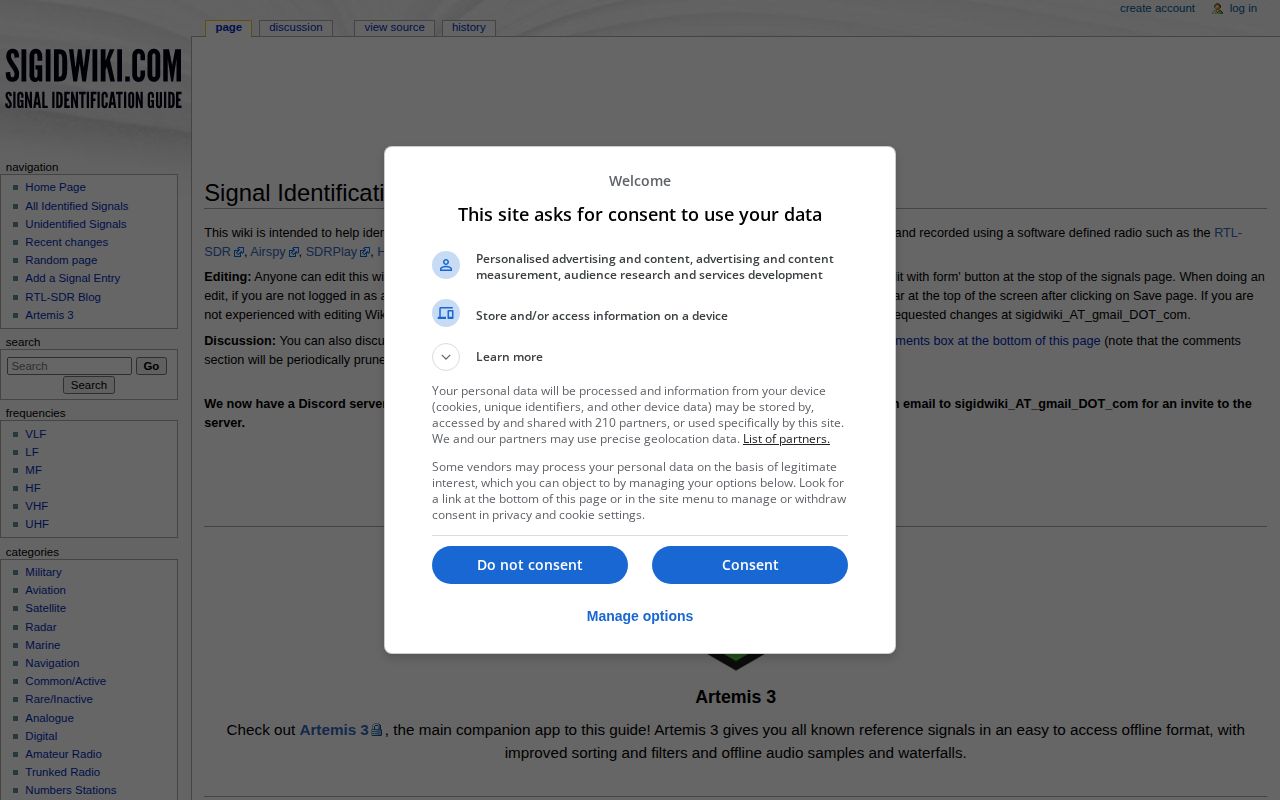
SCI Signal Identification Wiki
Database of radio signals. Identify unknown transmissions by their sound and waterfall pattern.
 SCI
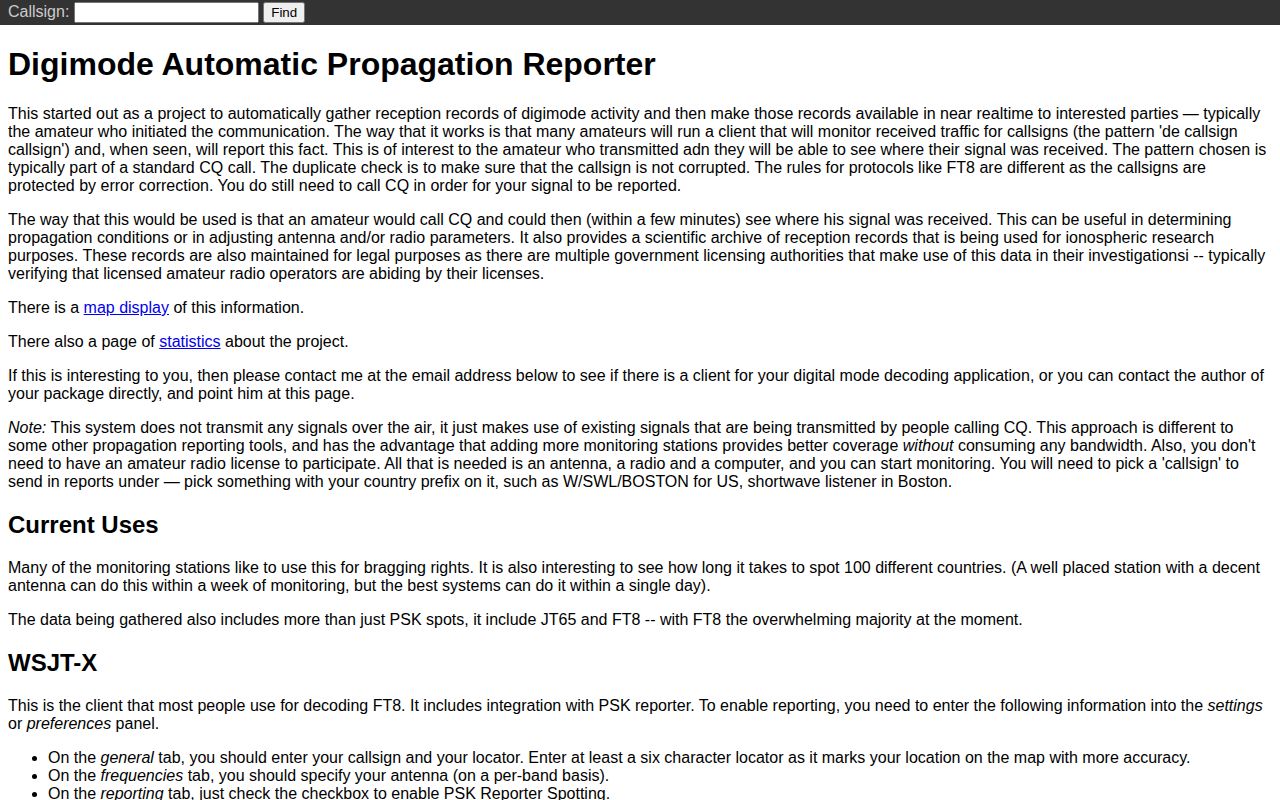
SCI PSK Reporter
Real-time map of digital mode amateur radio signals. Watch FT8, WSPR, and other modes propagate globally.
 SCI
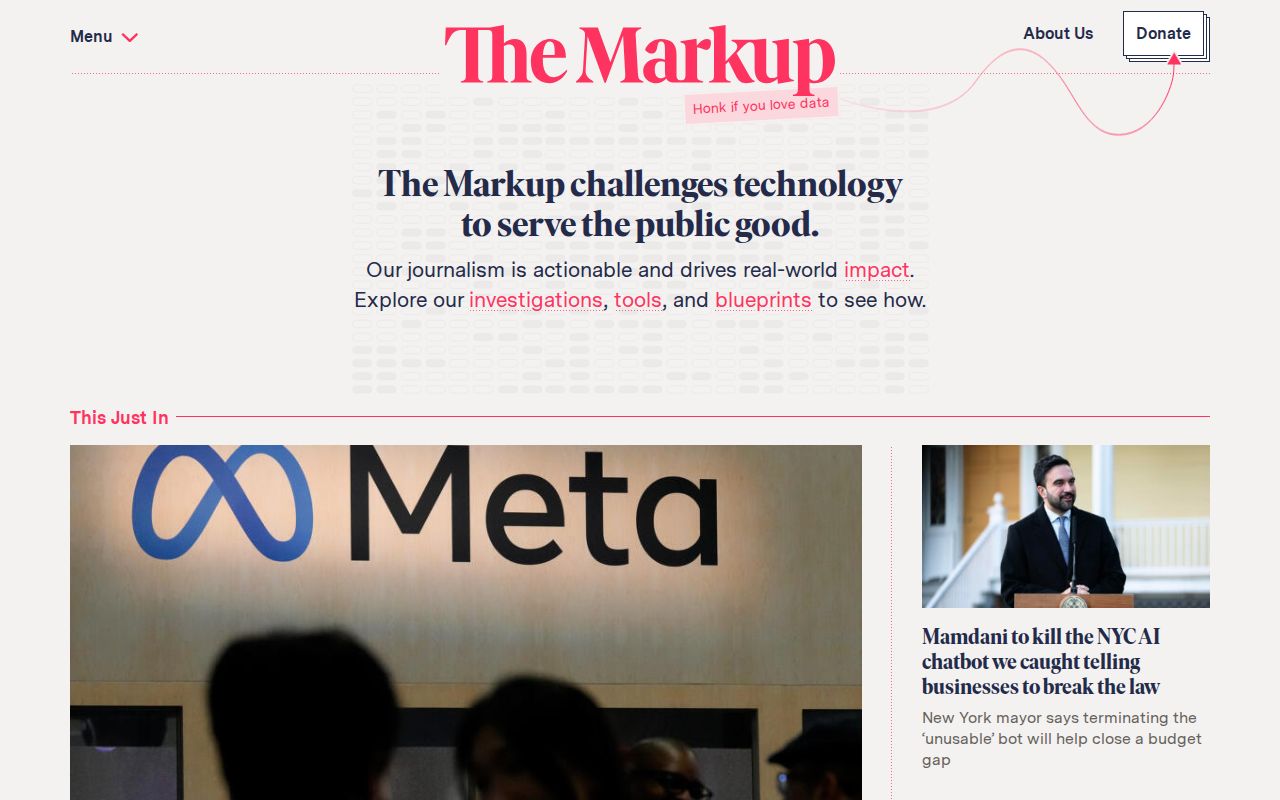
SCI The Markup
Data-driven investigative journalism on technology. Exposing how algorithms affect our lives.
 SCI
SCI NASA Climate
NASA's portal for climate science. Vital signs of the planet, evidence, and visualizations.
 SCI
SCI Awesome Data Science
Curated list of data science resources. Learning paths, tools, and datasets.
 SCI
SCI Awesome Machine Learning
Curated list of ML frameworks, libraries, and resources across multiple languages.
 SCI
SCI Global Forest Watch
Real-time monitoring of forests worldwide. Track deforestation and forest fires globally.
 SCI
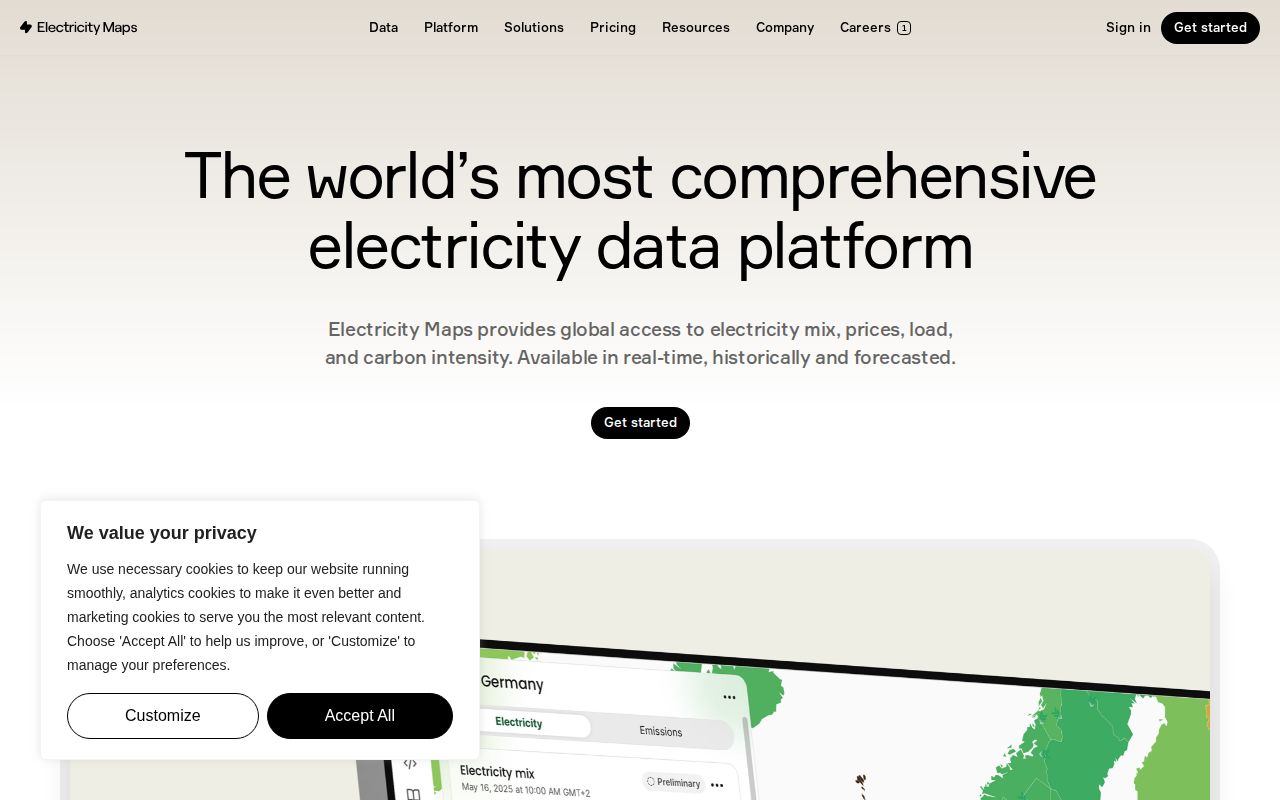
SCI Electricity Maps
Real-time visualization of electricity consumption and carbon intensity worldwide.
 SCI
SCI GovTrack
Track the U.S. Congress. Bills, votes, and congressional activity made accessible.
 SCI
SCI Open States
Track state legislation across all 50 U.S. states. Open data on state politics.
OpenSecrets
Follow the money in politics. Campaign finance and lobbying data made accessible.
 SCI
SCI IMDb
The Internet Movie Database. Comprehensive information on films, TV, and cast.
 SCI
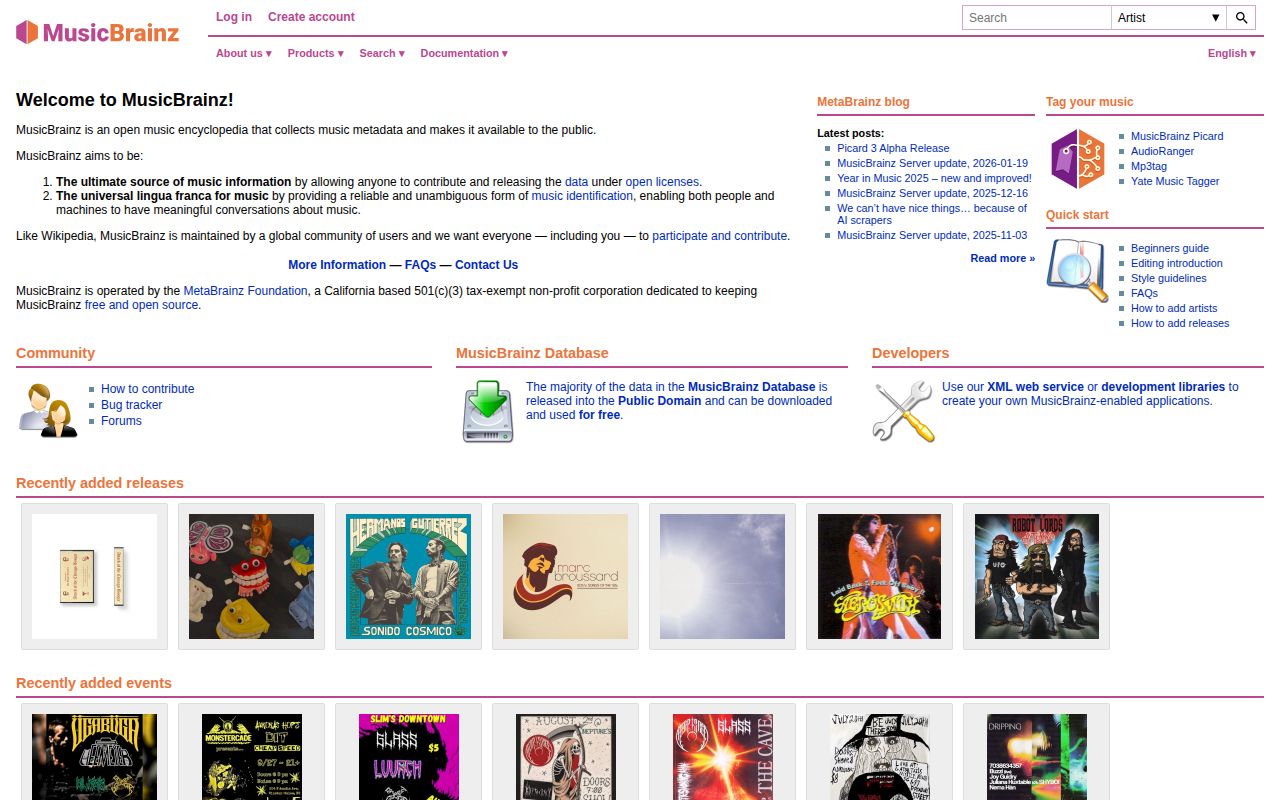
SCI MusicBrainz
Open music encyclopedia. Community-maintained database of music metadata used by many apps.
 SCI
SCI ShadeMap
3D shade map of the entire world. See shadows from mountains, buildings, and trees for any date and time.
 SCI
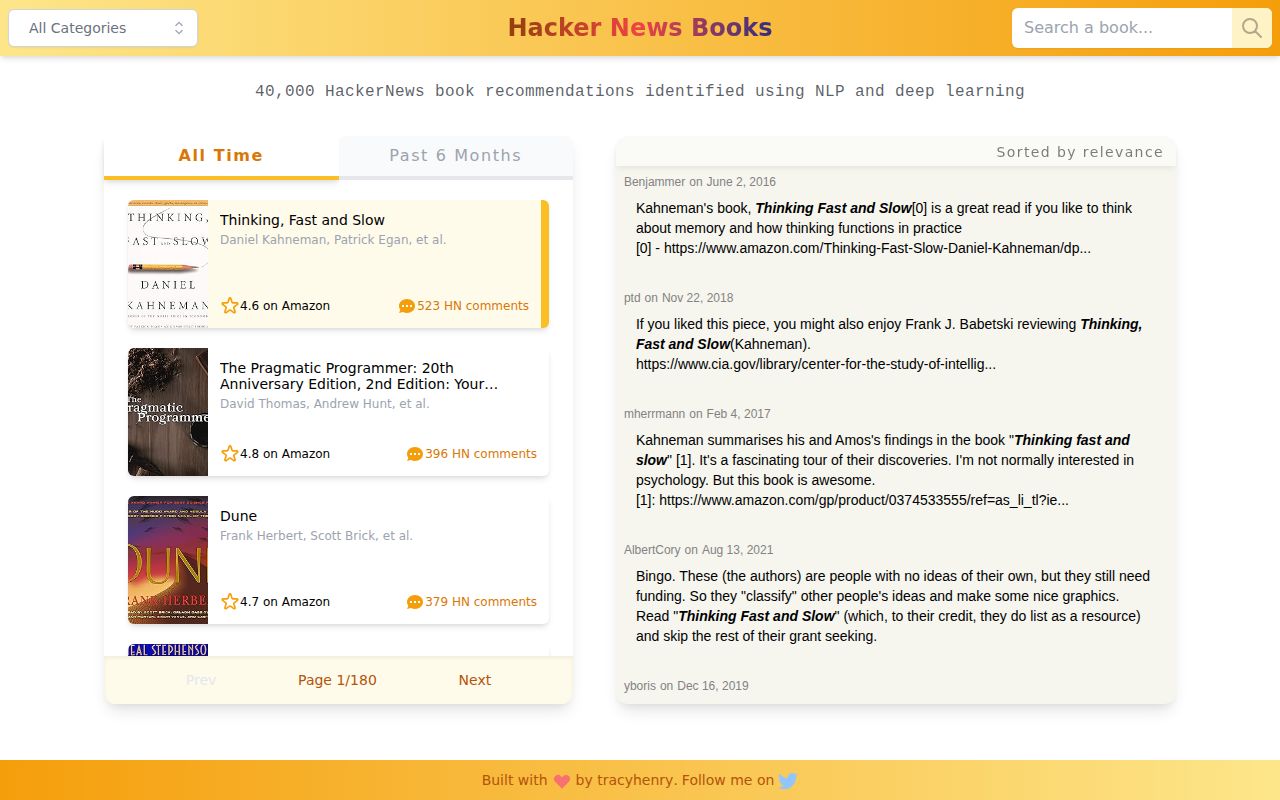
SCI Hacker Recommended Books
Books extracted from 40k Hacker News comments using deep learning. Discover what HN readers actually recommend.
 SCI
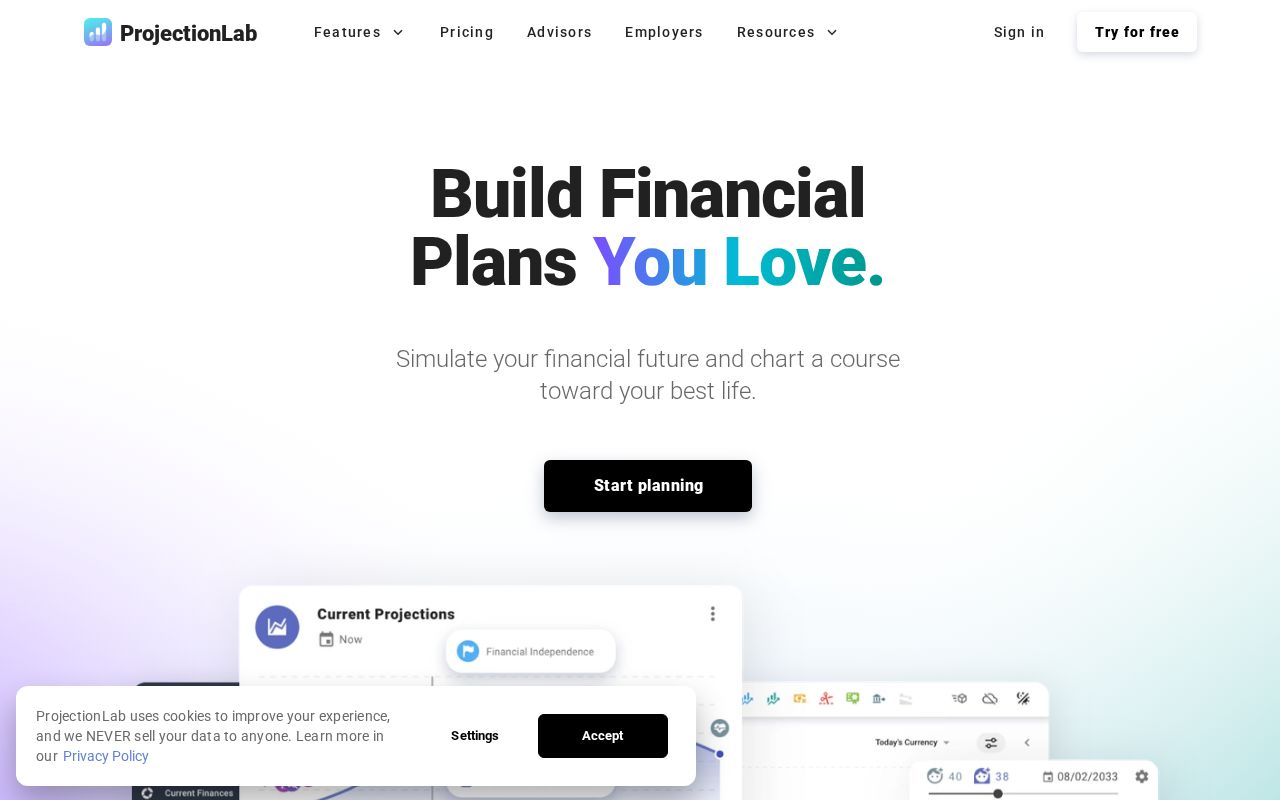
SCI ProjectionLab
Personal finance simulator. Model different scenarios for retirement, investments, and life decisions.
 SCI
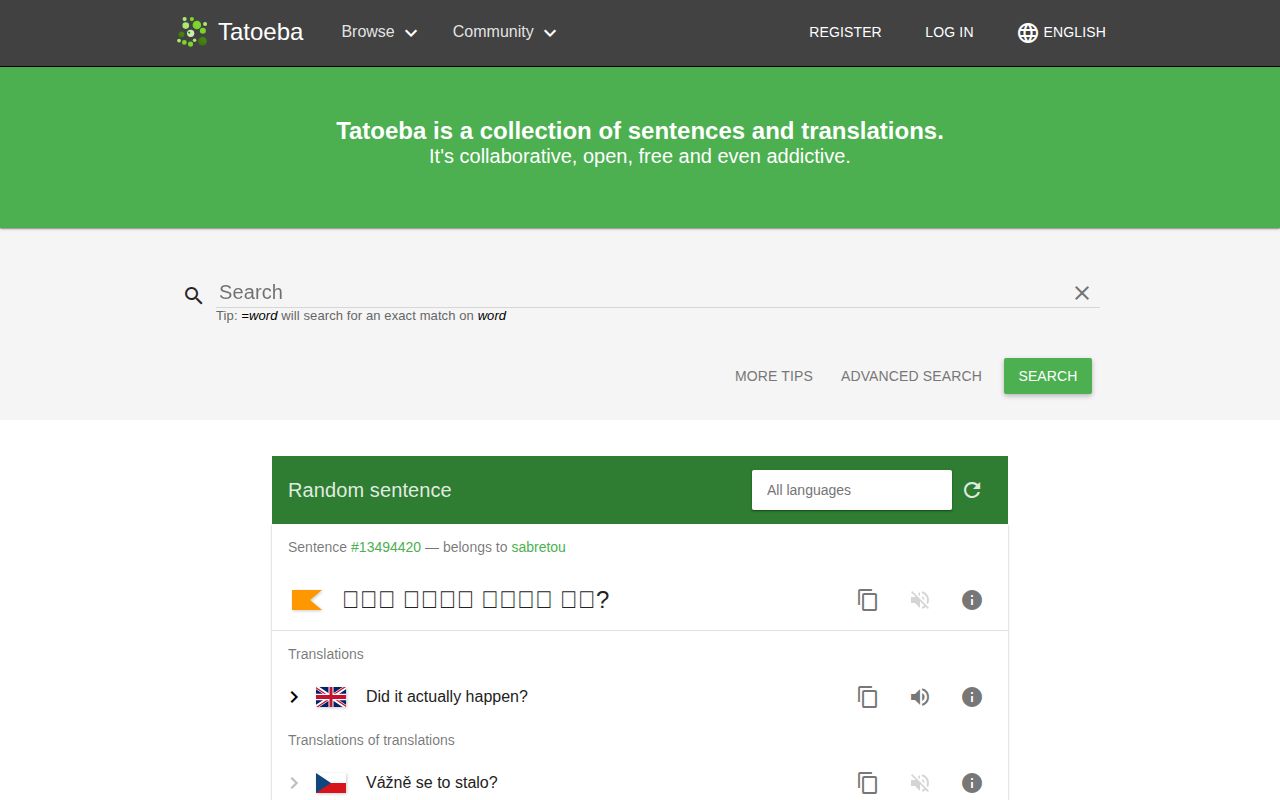
SCI Tatoeba
Collection of sentences and translations. User-contributed parallel corpus for language learning.
 SCI
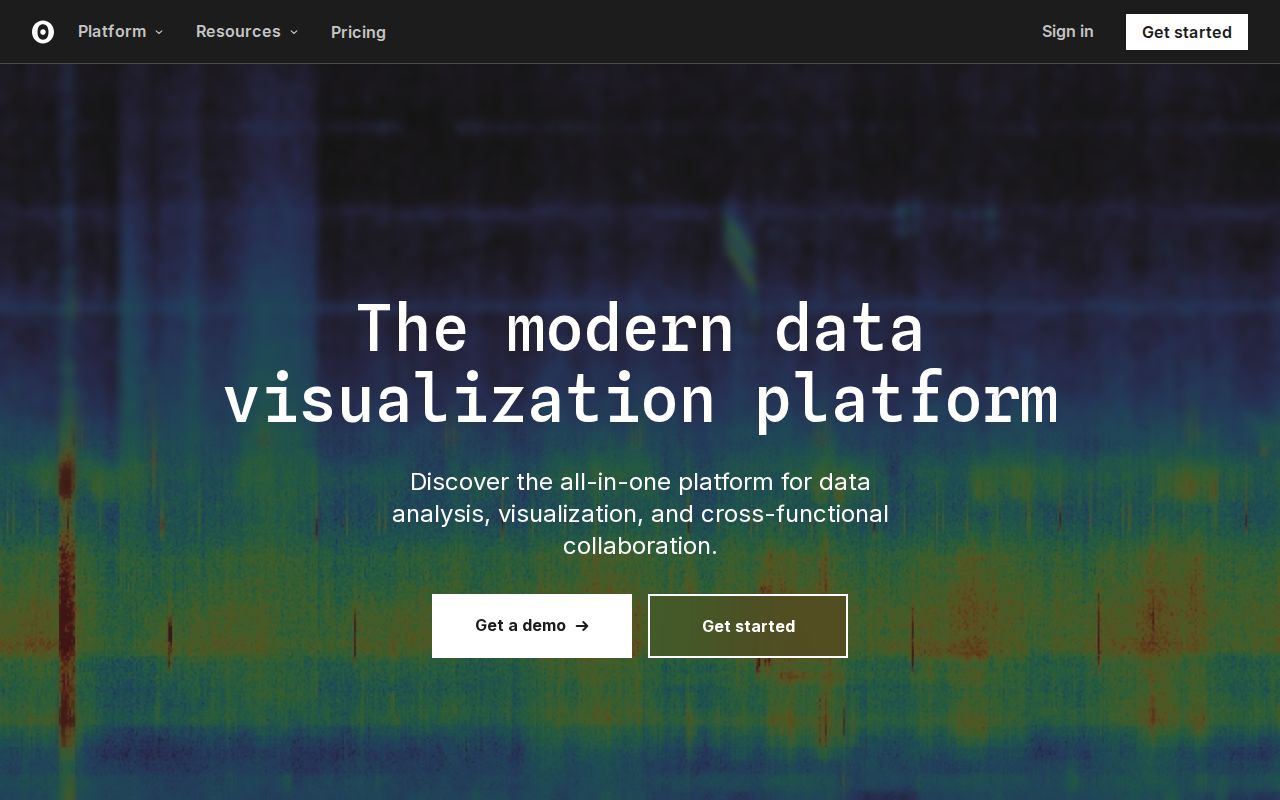
SCI Observable
Collaborative data visualization platform. JavaScript notebooks for exploring and sharing data insights.
 SCI
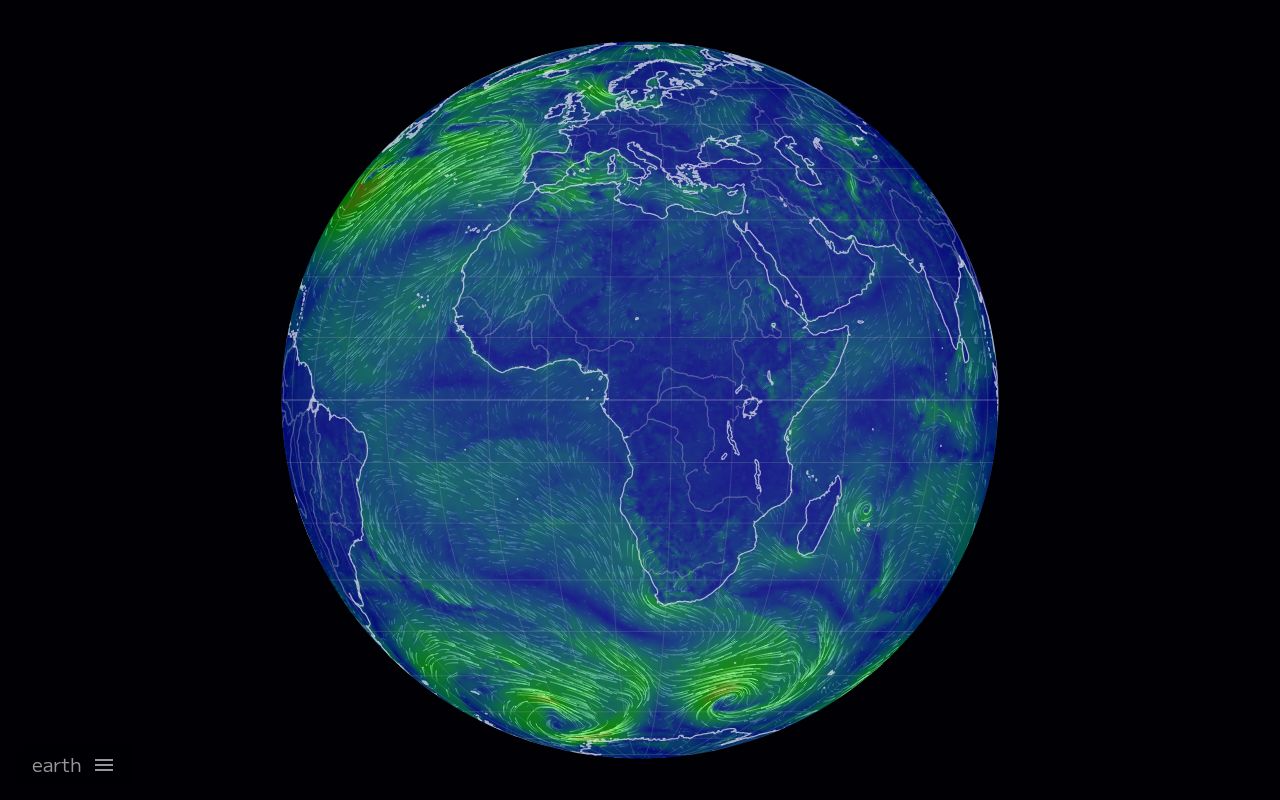
SCI Earth Wind Map
Real-time visualization of global weather conditions. Hypnotic animation of wind, temperature, and more.
 SCI
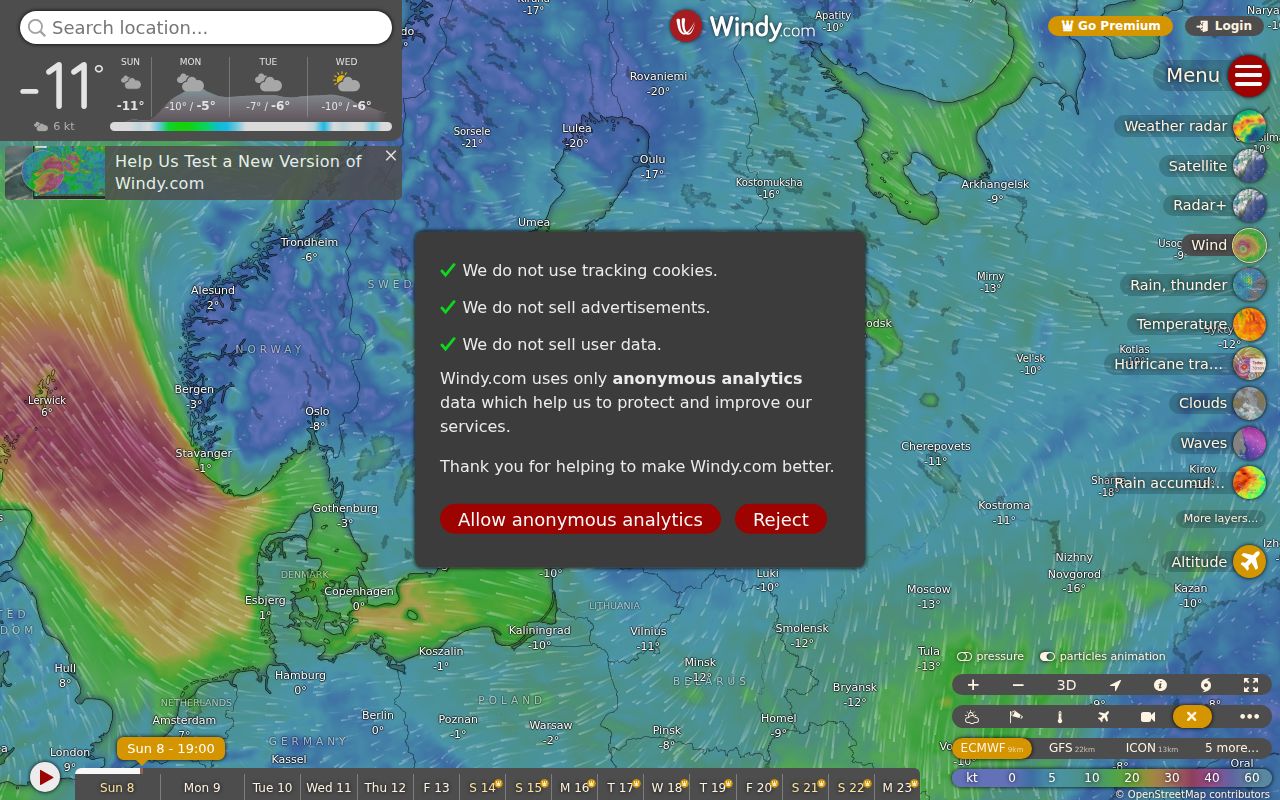
SCI Windy
Beautiful weather forecasting. Detailed models, radar, and satellite imagery in an elegant interface.
 SCI
SCI Investopedia
Financial education and market data. Learn investing concepts and track markets.
 SCI
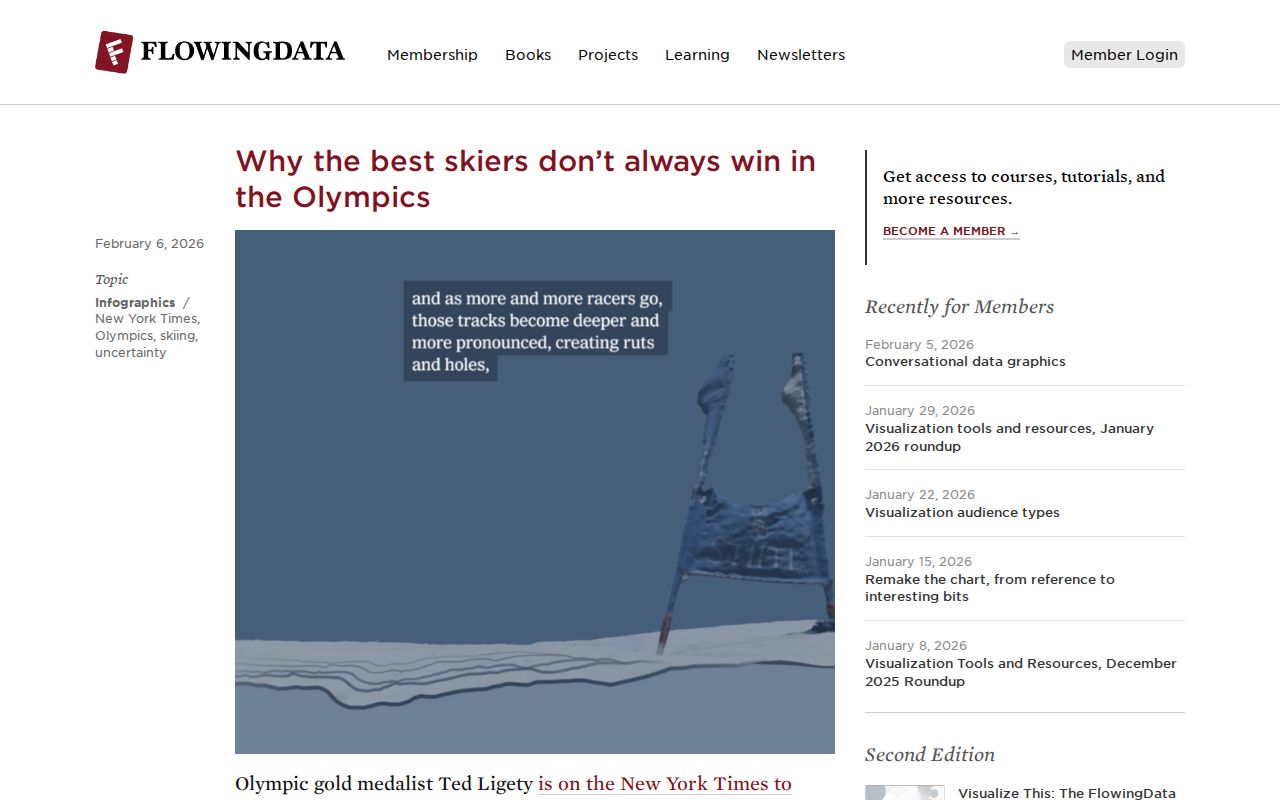
SCI FlowingData
Nathan Yau's data visualization blog. Tutorials, inspiration, and commentary on visualizing information.
 SCI
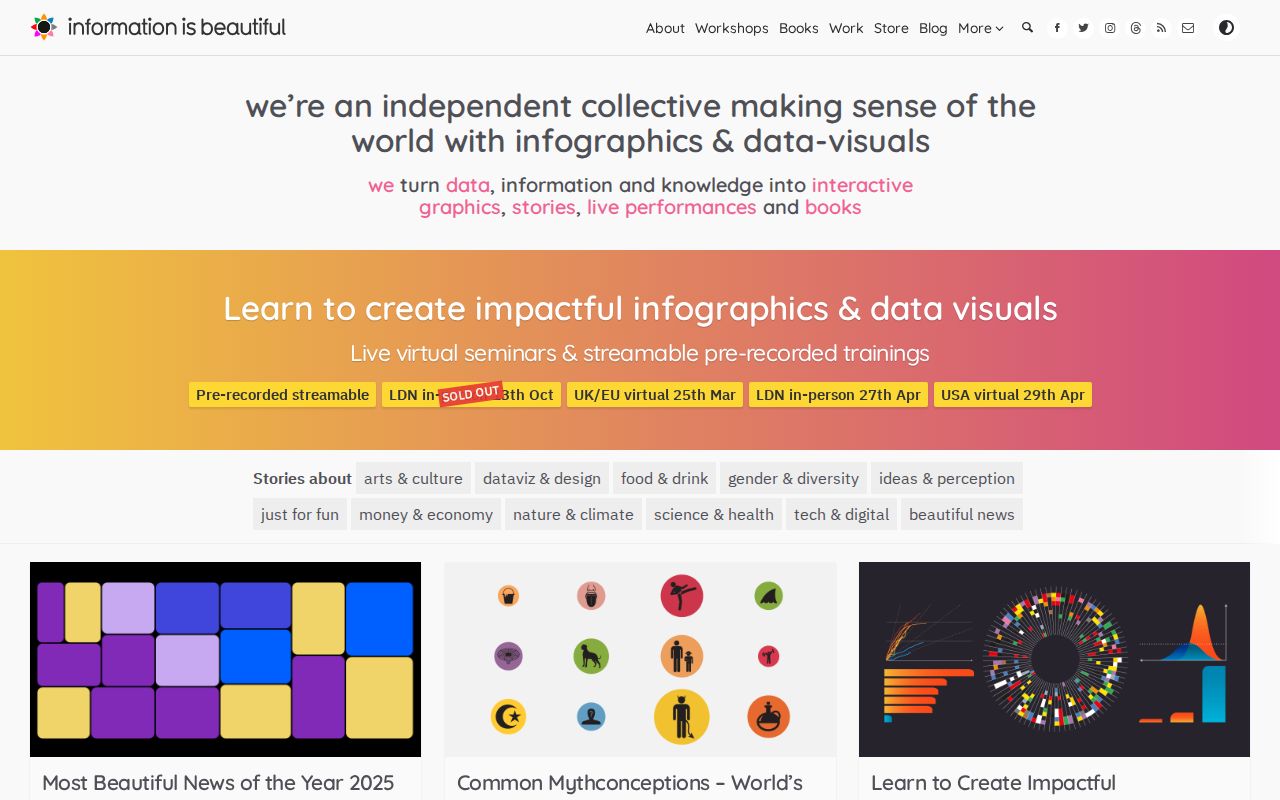
SCI Information is Beautiful
Award-winning data visualization. Complex information made accessible through beautiful graphics.
 SCI
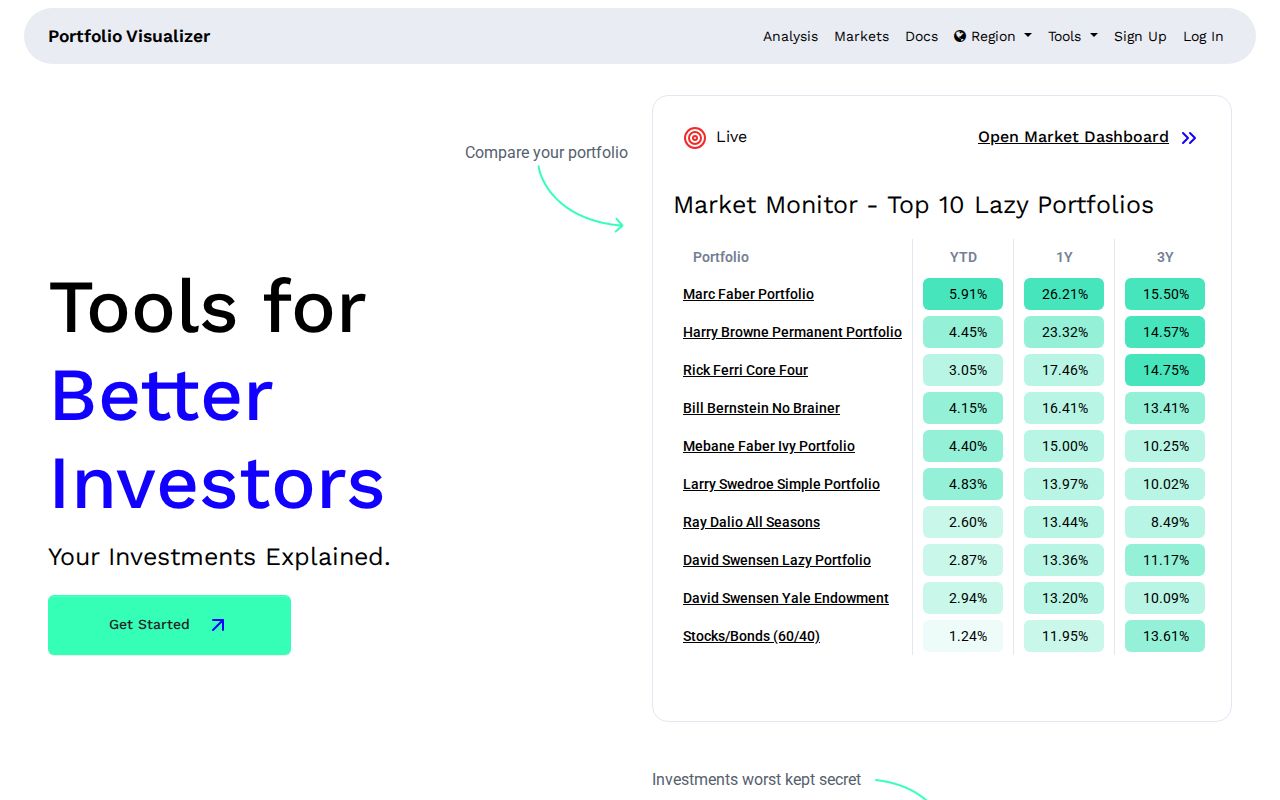
SCI Portfolio Visualizer
Backtest and analyze investment portfolios. Monte Carlo simulation and factor analysis.
 SCI
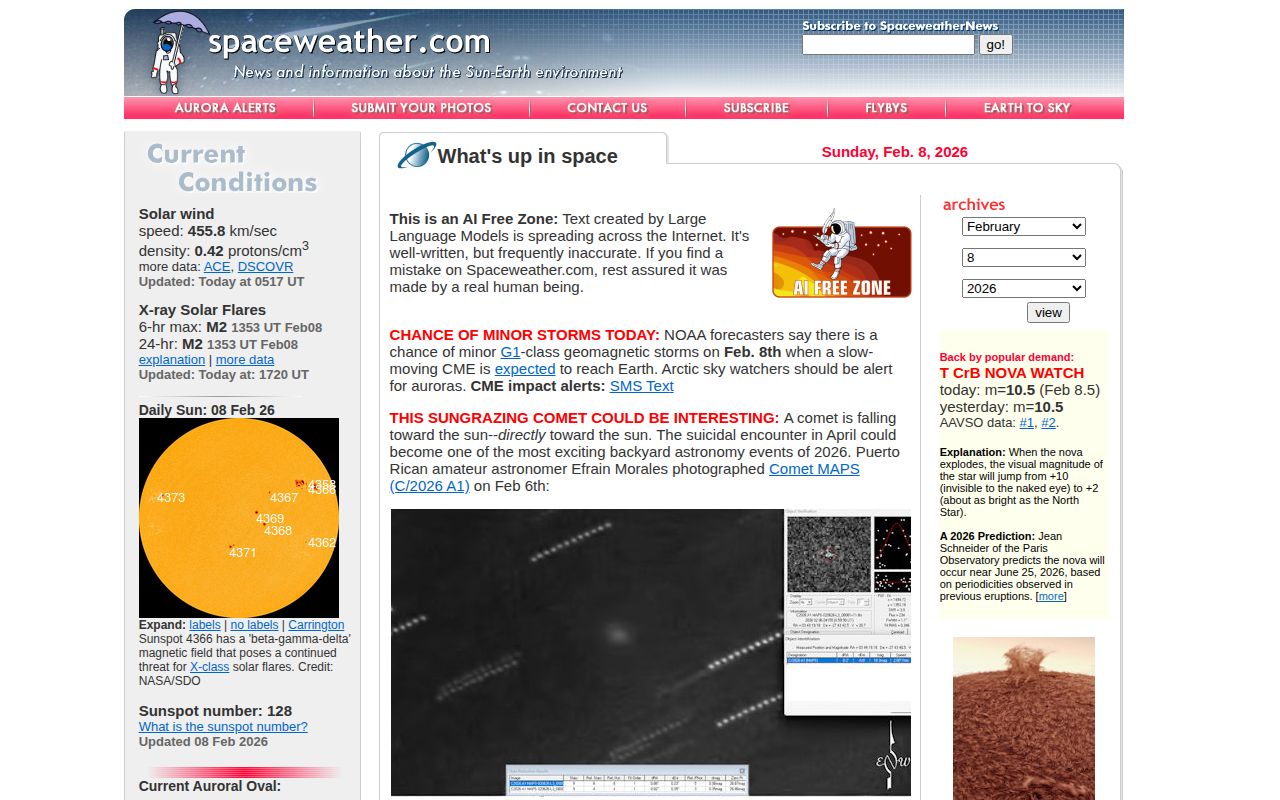
SCI SpaceWeather
Solar activity and space weather. Aurora forecasts, meteor showers, and sun news.
 SCI
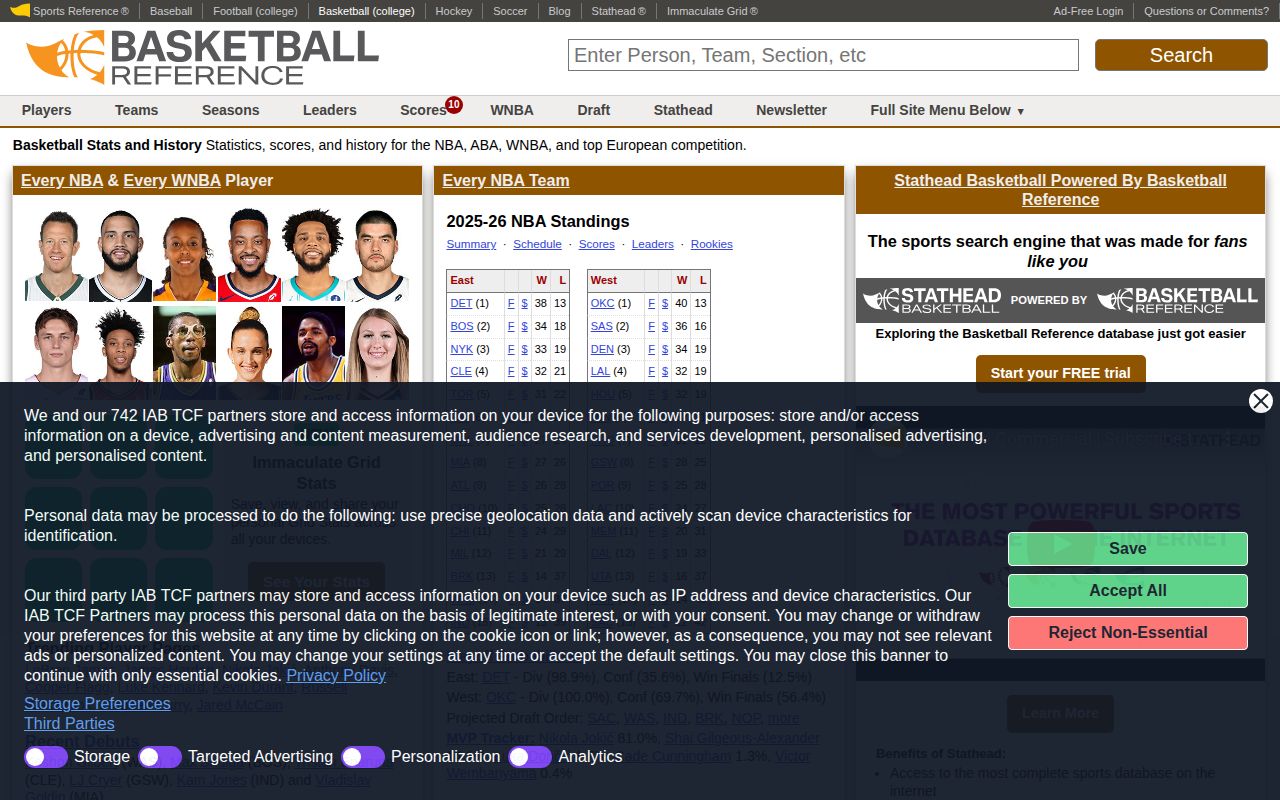
SCI Basketball Reference
Complete basketball statistics. Every player, every game, every stat.
 SCI
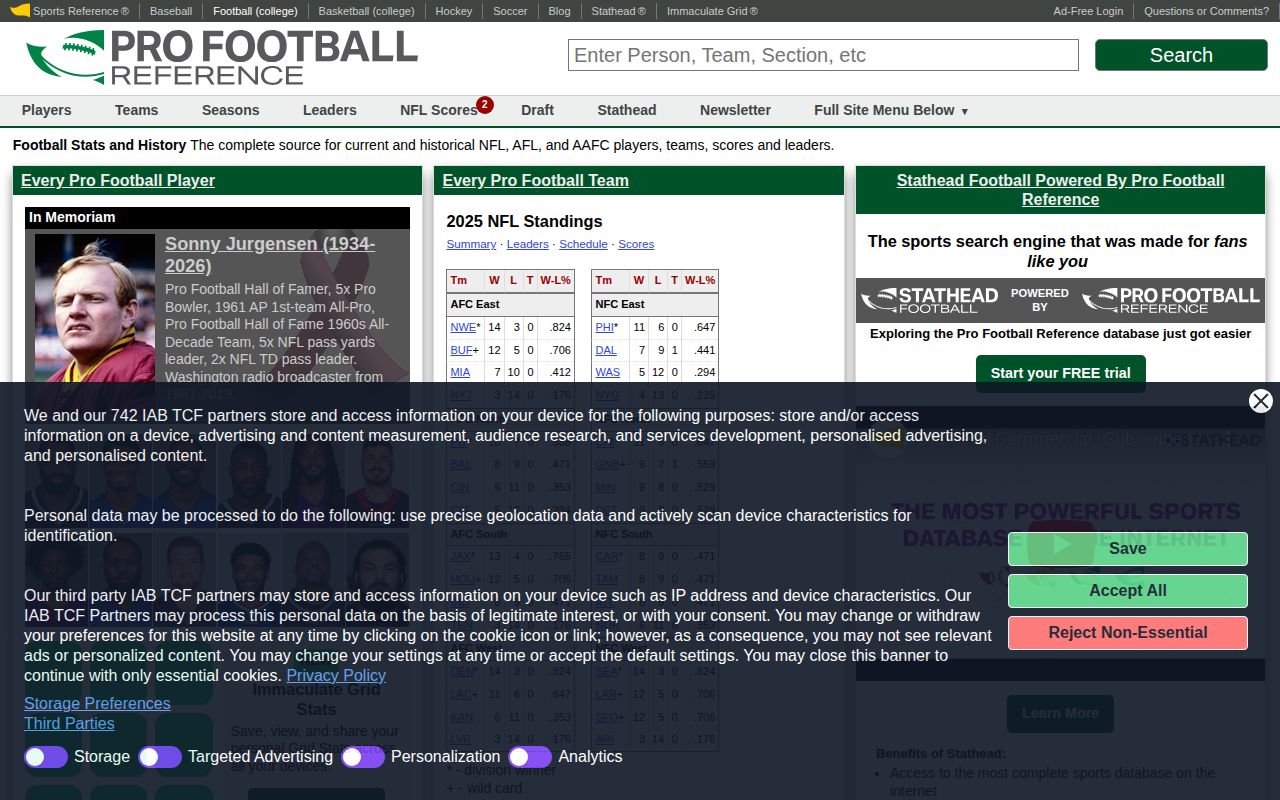
SCI Pro Football Reference
Complete NFL statistics database. Historical and current stats.
 SCI
SCI FBref
Soccer/football statistics. Comprehensive data from leagues worldwide.
 SCI
SCI Podcast Index
Open podcast database. Supporting an open podcasting ecosystem.
 SCI
SCI levels.fyi
Tech compensation data. Compare salaries across companies and levels.
EPA
U.S. Environmental Protection Agency. Environmental data and regulations.
 SCI
SCI IUCN Red List
Threatened species database. Conservation status of species worldwide.
 SCI
SCI Wolfram Alpha
Computational knowledge engine. Ask it math, science, or data questions and get computed answers.
 SCI
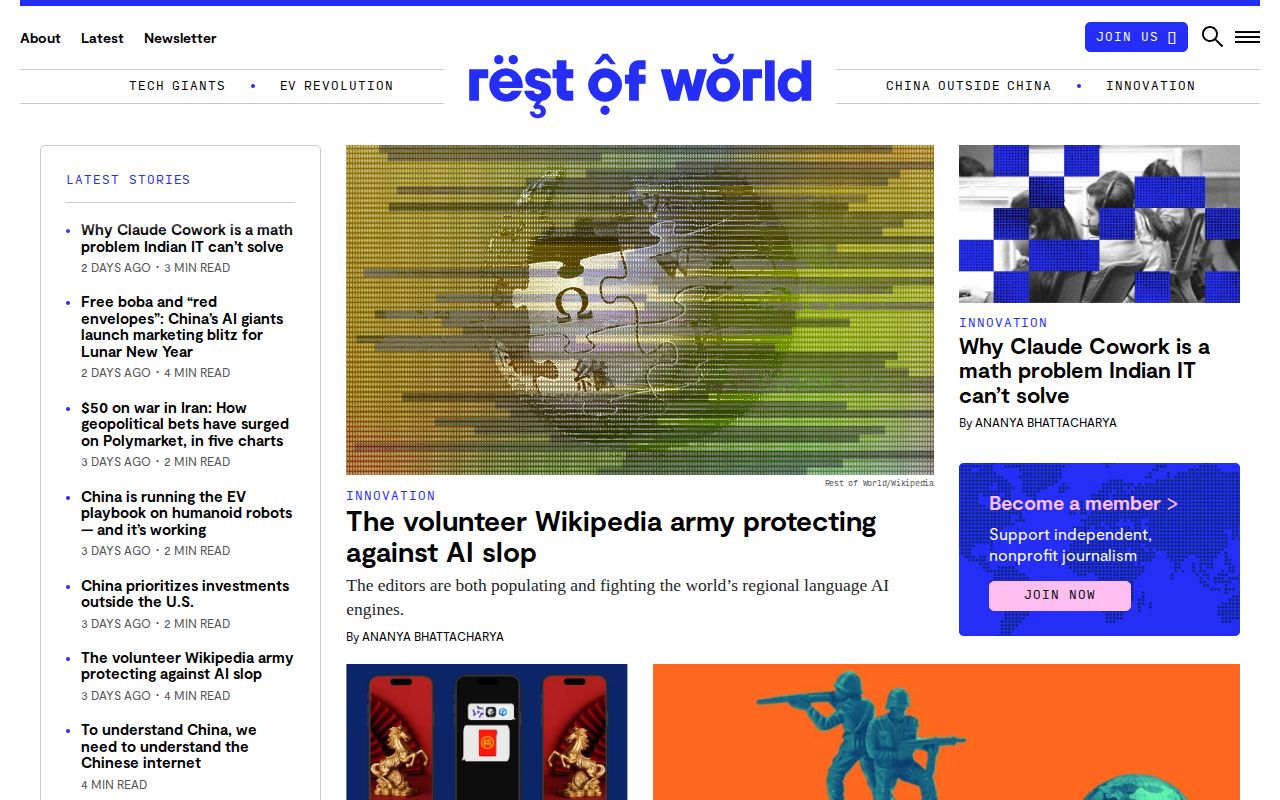
SCI Rest of World
Tech reporting from outside the Western bubble. How technology shapes life in emerging markets.
 SCI
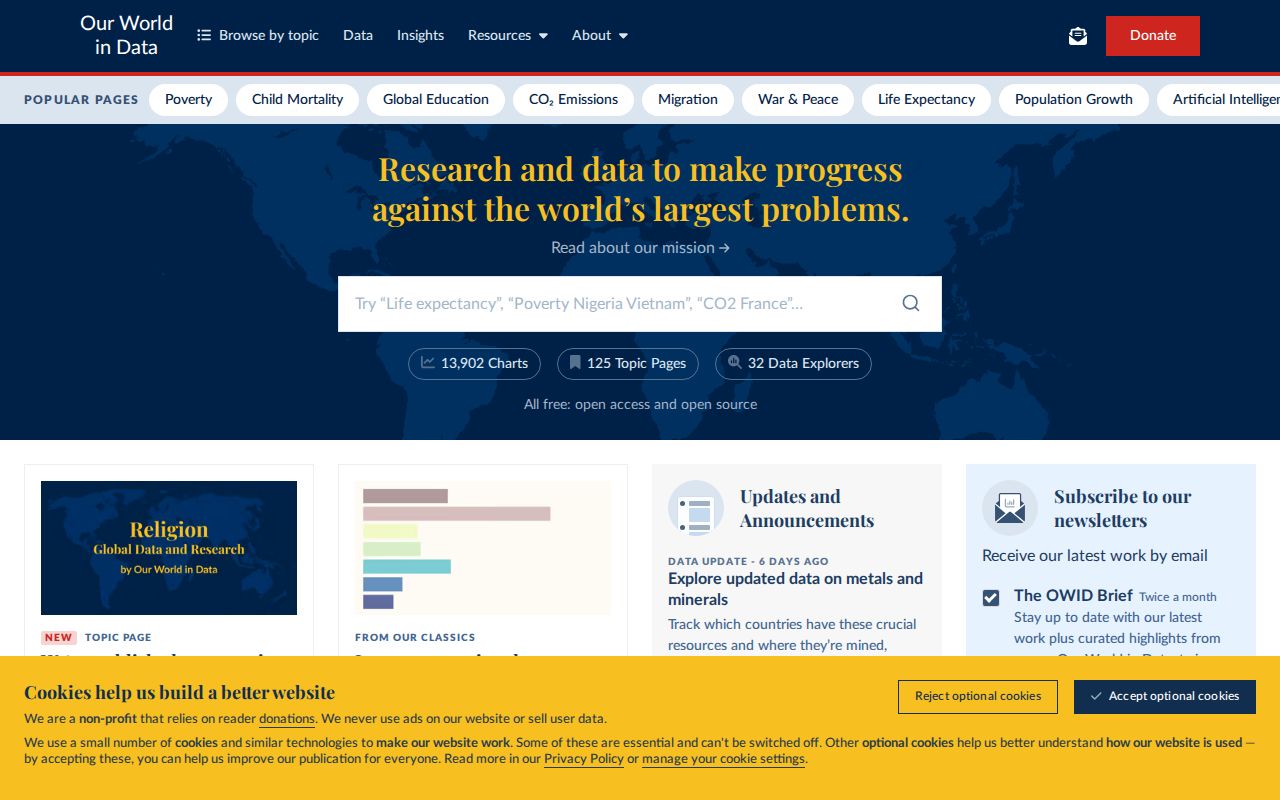
SCI Our World in Data
Research and data to make progress against the world's largest problems. Free, open, accessible.
 SCI
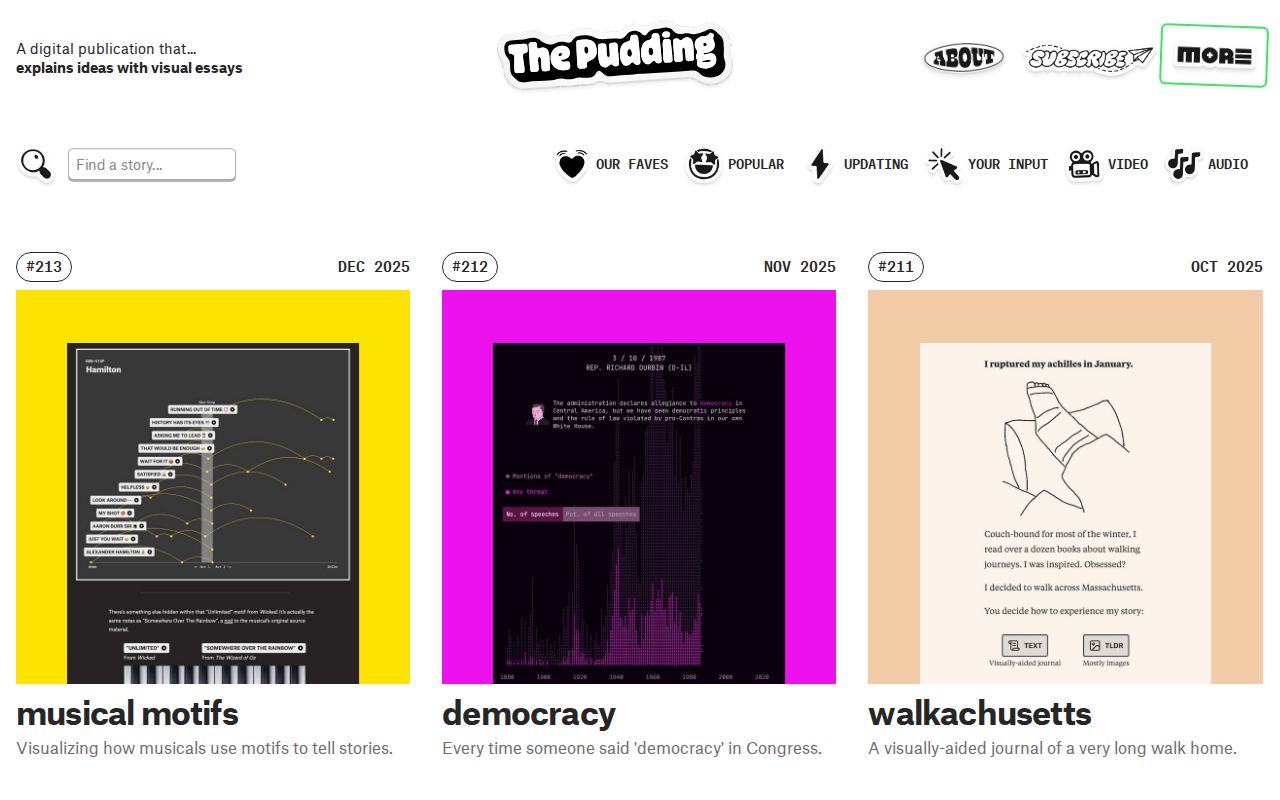
SCI The Pudding
Visual essays that explain ideas through data and design. Journalism meets data visualization.
 SCI
SCI Information is Beautiful
Award-winning data visualizations on everything from science to pop culture.